Fig. 8.
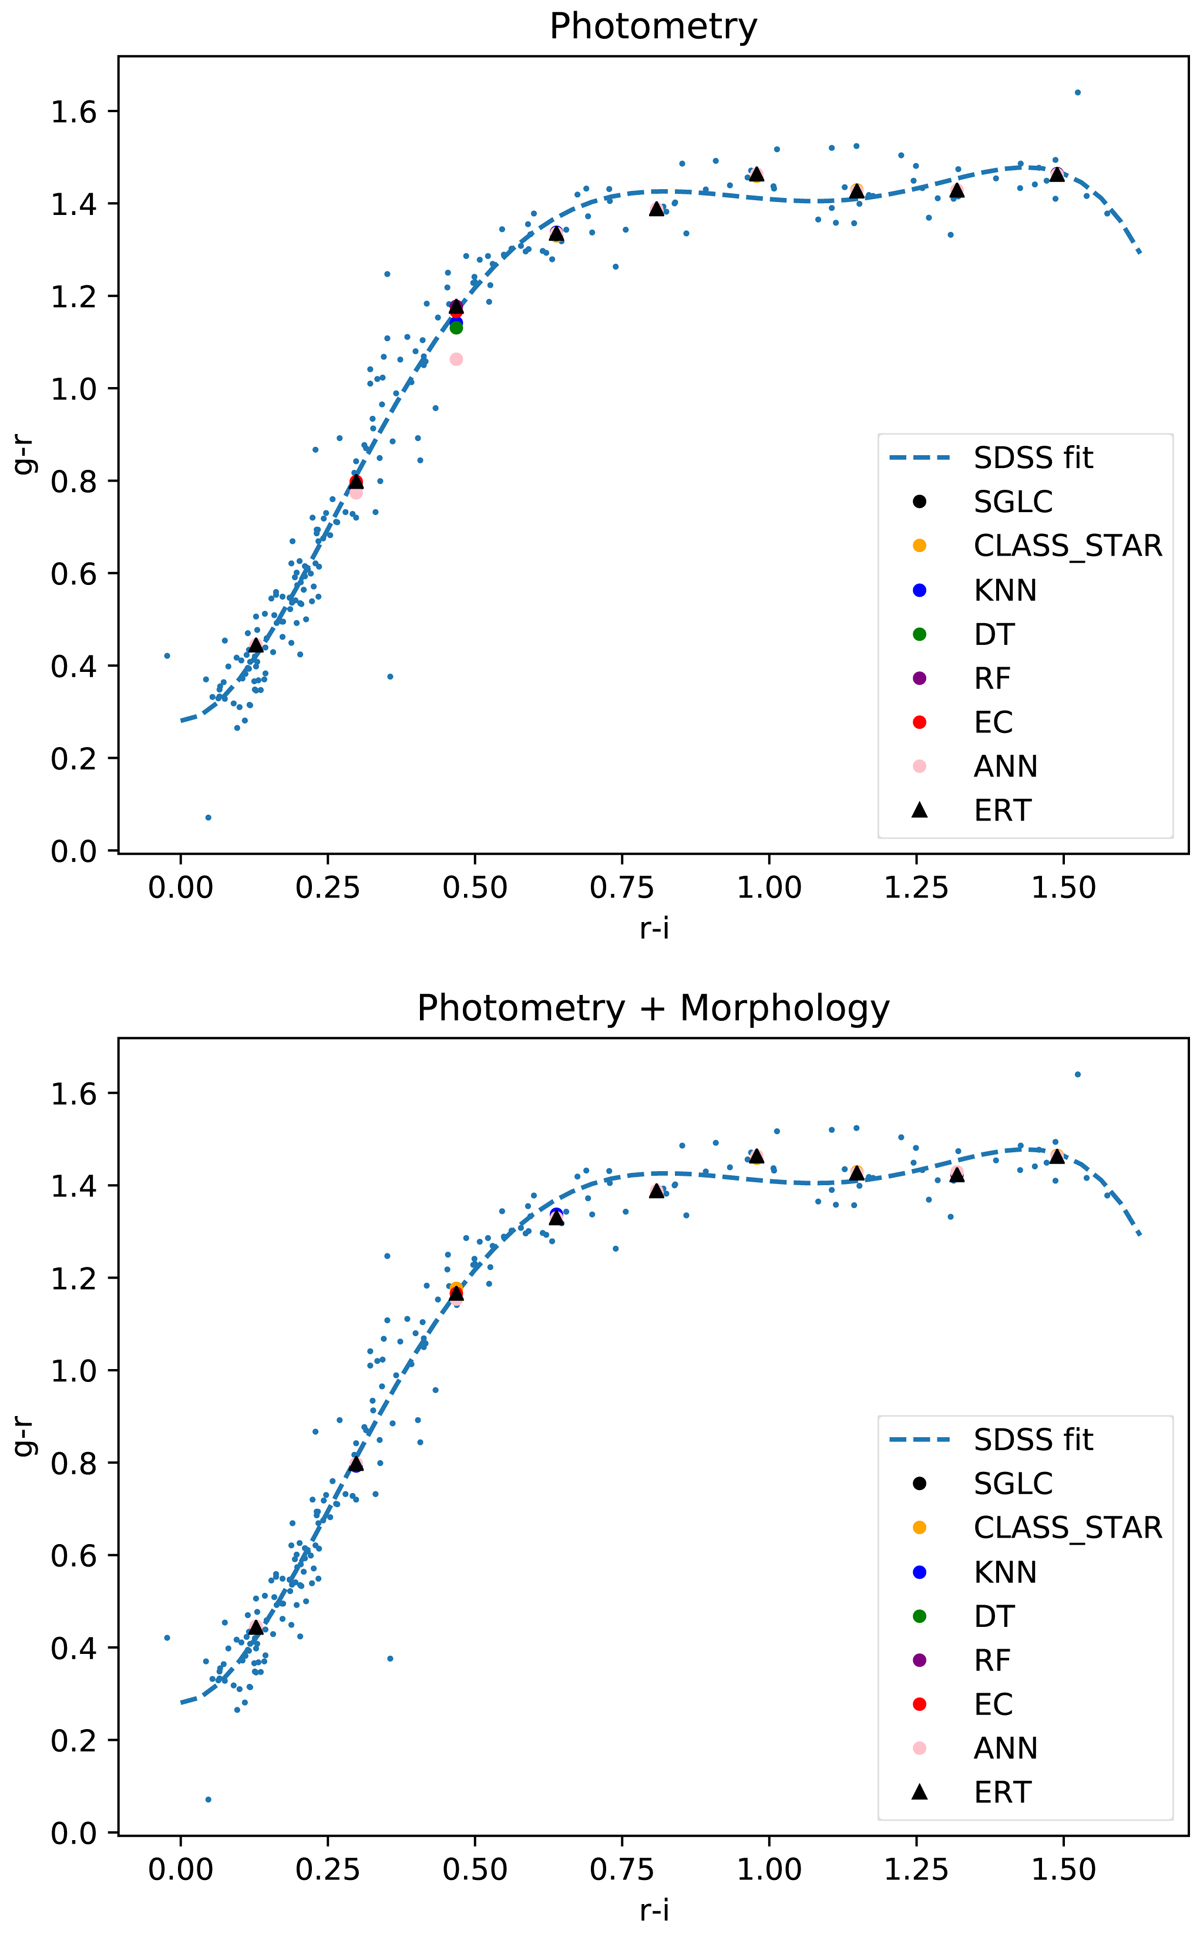
Stellar locus characterization. The small blue dots represent the stellar locus for the objects classified as stars (p ≤ pcut = 0.5) of the miniJPAS catalog cross-matched with the SDSS catalog in the magnitude interval 15 ≤ r ≤ 20. The dashed line represents a polynomial fit to the stellar locus. Top panel: analysis that uses only photometric bands, and bottom panel: analysis that also uses morphological information. The larger colored symbols represent the mean stellar locus provided by the different ML models. For comparison we also show the classification by CLASS_STAR and SGLC, which always use morphological parameters.
Current usage metrics show cumulative count of Article Views (full-text article views including HTML views, PDF and ePub downloads, according to the available data) and Abstracts Views on Vision4Press platform.
Data correspond to usage on the plateform after 2015. The current usage metrics is available 48-96 hours after online publication and is updated daily on week days.
Initial download of the metrics may take a while.