Fig. C.1.
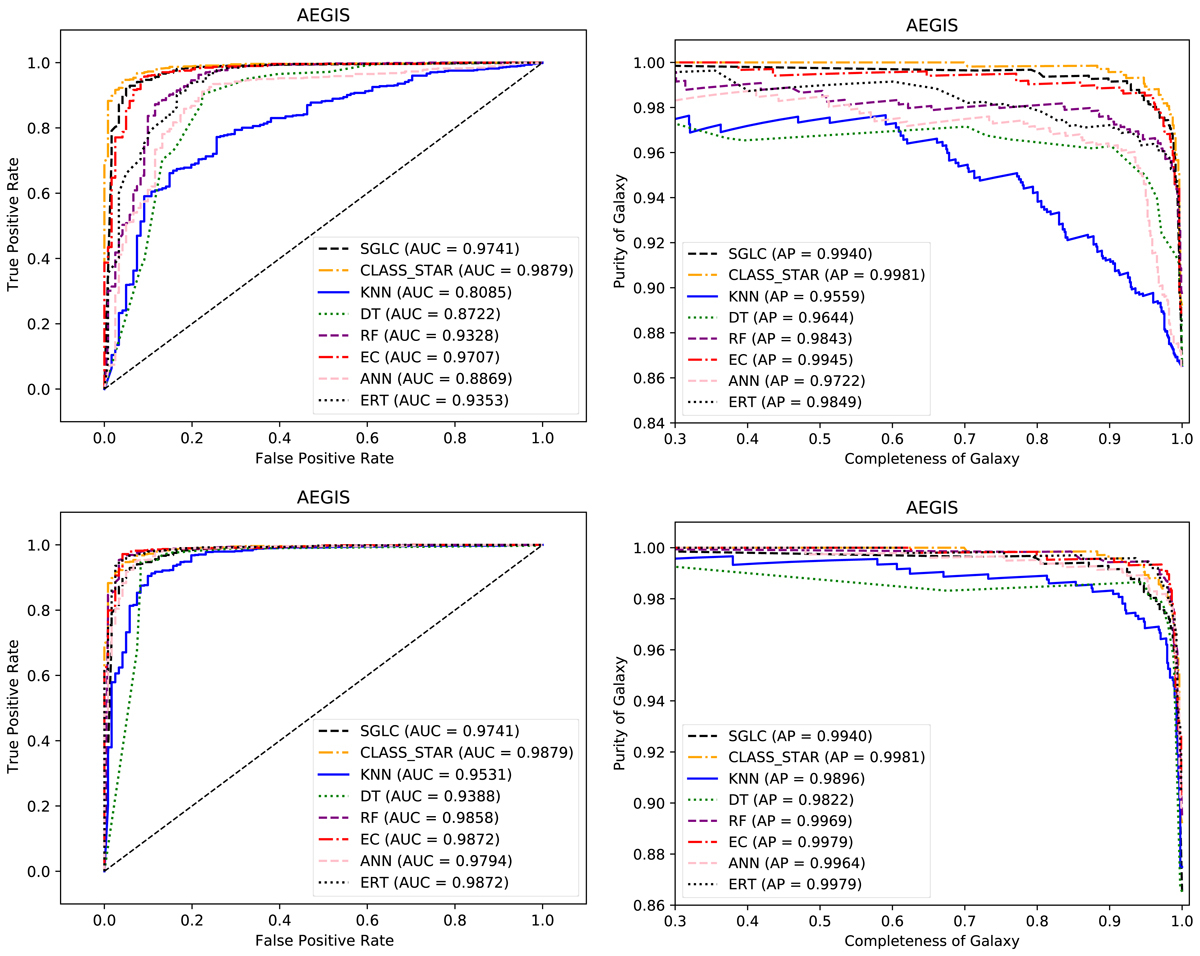
ROC curves (left panels) and purity curves for galaxies (right panels) for the classifiers considered in this paper for the AEGIS1 field cross-matched with the HSC-SSP catalog in the magnitude interval 18.5 ≤ r ≤ 23.5. Top panels: analysis that uses only photometric bands, and bottom panels: analysis that uses photometric bands and morphological parameters. For comparison we also show the classification by CLASS_STAR and SGLC, which always use morphological parameters. The axes ranges are varied in order to show the curves better.
Current usage metrics show cumulative count of Article Views (full-text article views including HTML views, PDF and ePub downloads, according to the available data) and Abstracts Views on Vision4Press platform.
Data correspond to usage on the plateform after 2015. The current usage metrics is available 48-96 hours after online publication and is updated daily on week days.
Initial download of the metrics may take a while.