Fig. B.1.
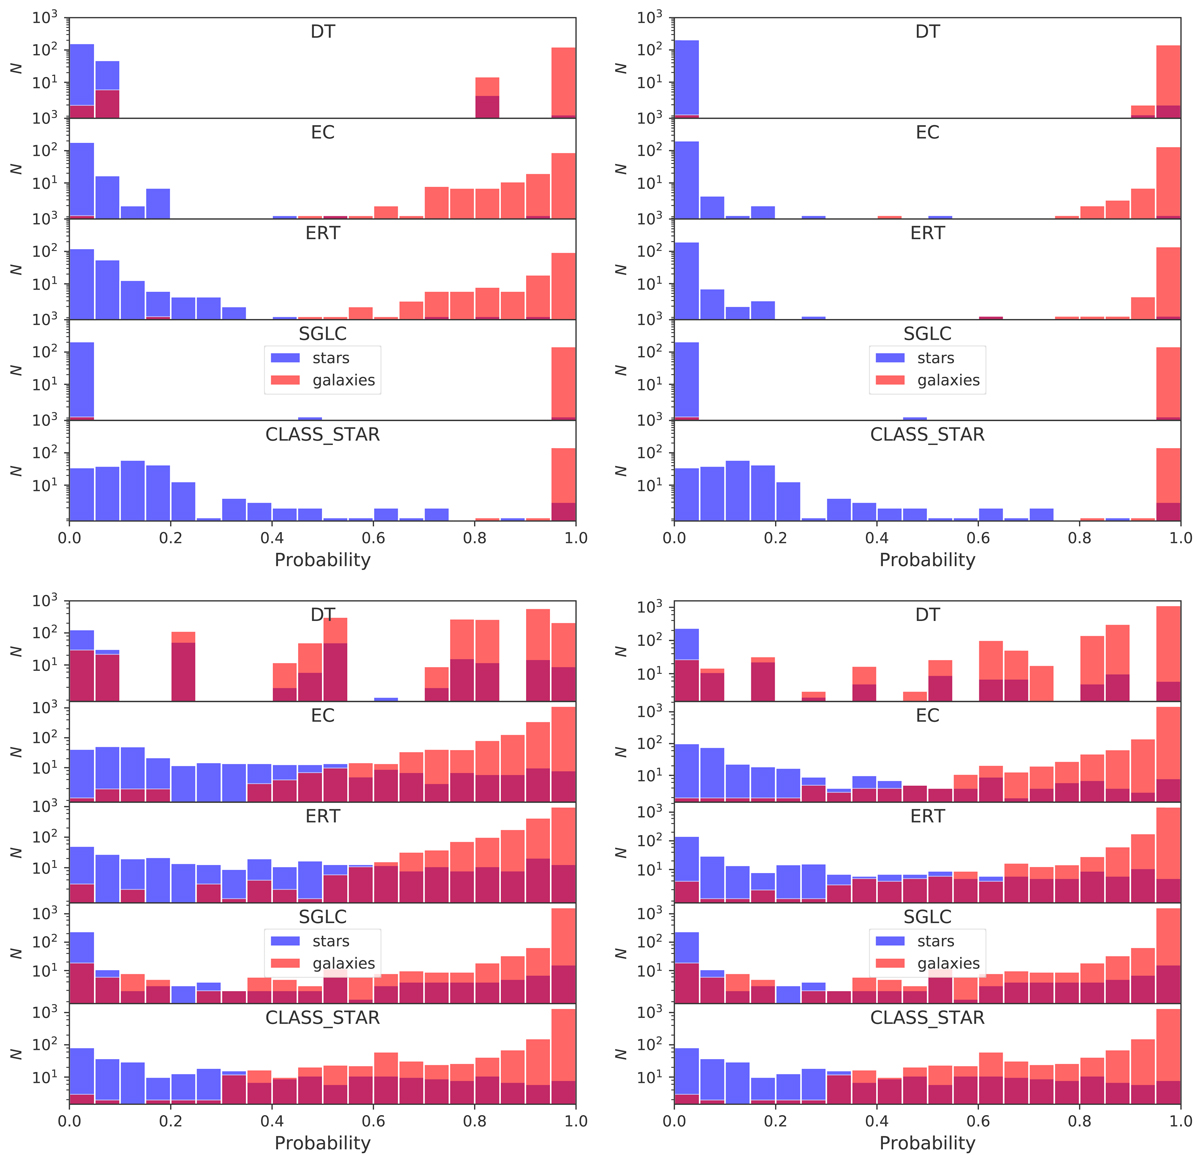
Histograms of the probability that a source belongs to the galaxy class. The histograms for actual stars and galaxies as classified by SDSS (top) and HSC-SSP (bottom) are plotted in blue and semi-transparent red, respectively. The panels on the left use only photometric information, and those on the right also use morphology. For comparison we also show the classification by CLASS_STAR and SGLC, which always use morphological parameters.
Current usage metrics show cumulative count of Article Views (full-text article views including HTML views, PDF and ePub downloads, according to the available data) and Abstracts Views on Vision4Press platform.
Data correspond to usage on the plateform after 2015. The current usage metrics is available 48-96 hours after online publication and is updated daily on week days.
Initial download of the metrics may take a while.