Free Access
Fig. 11.
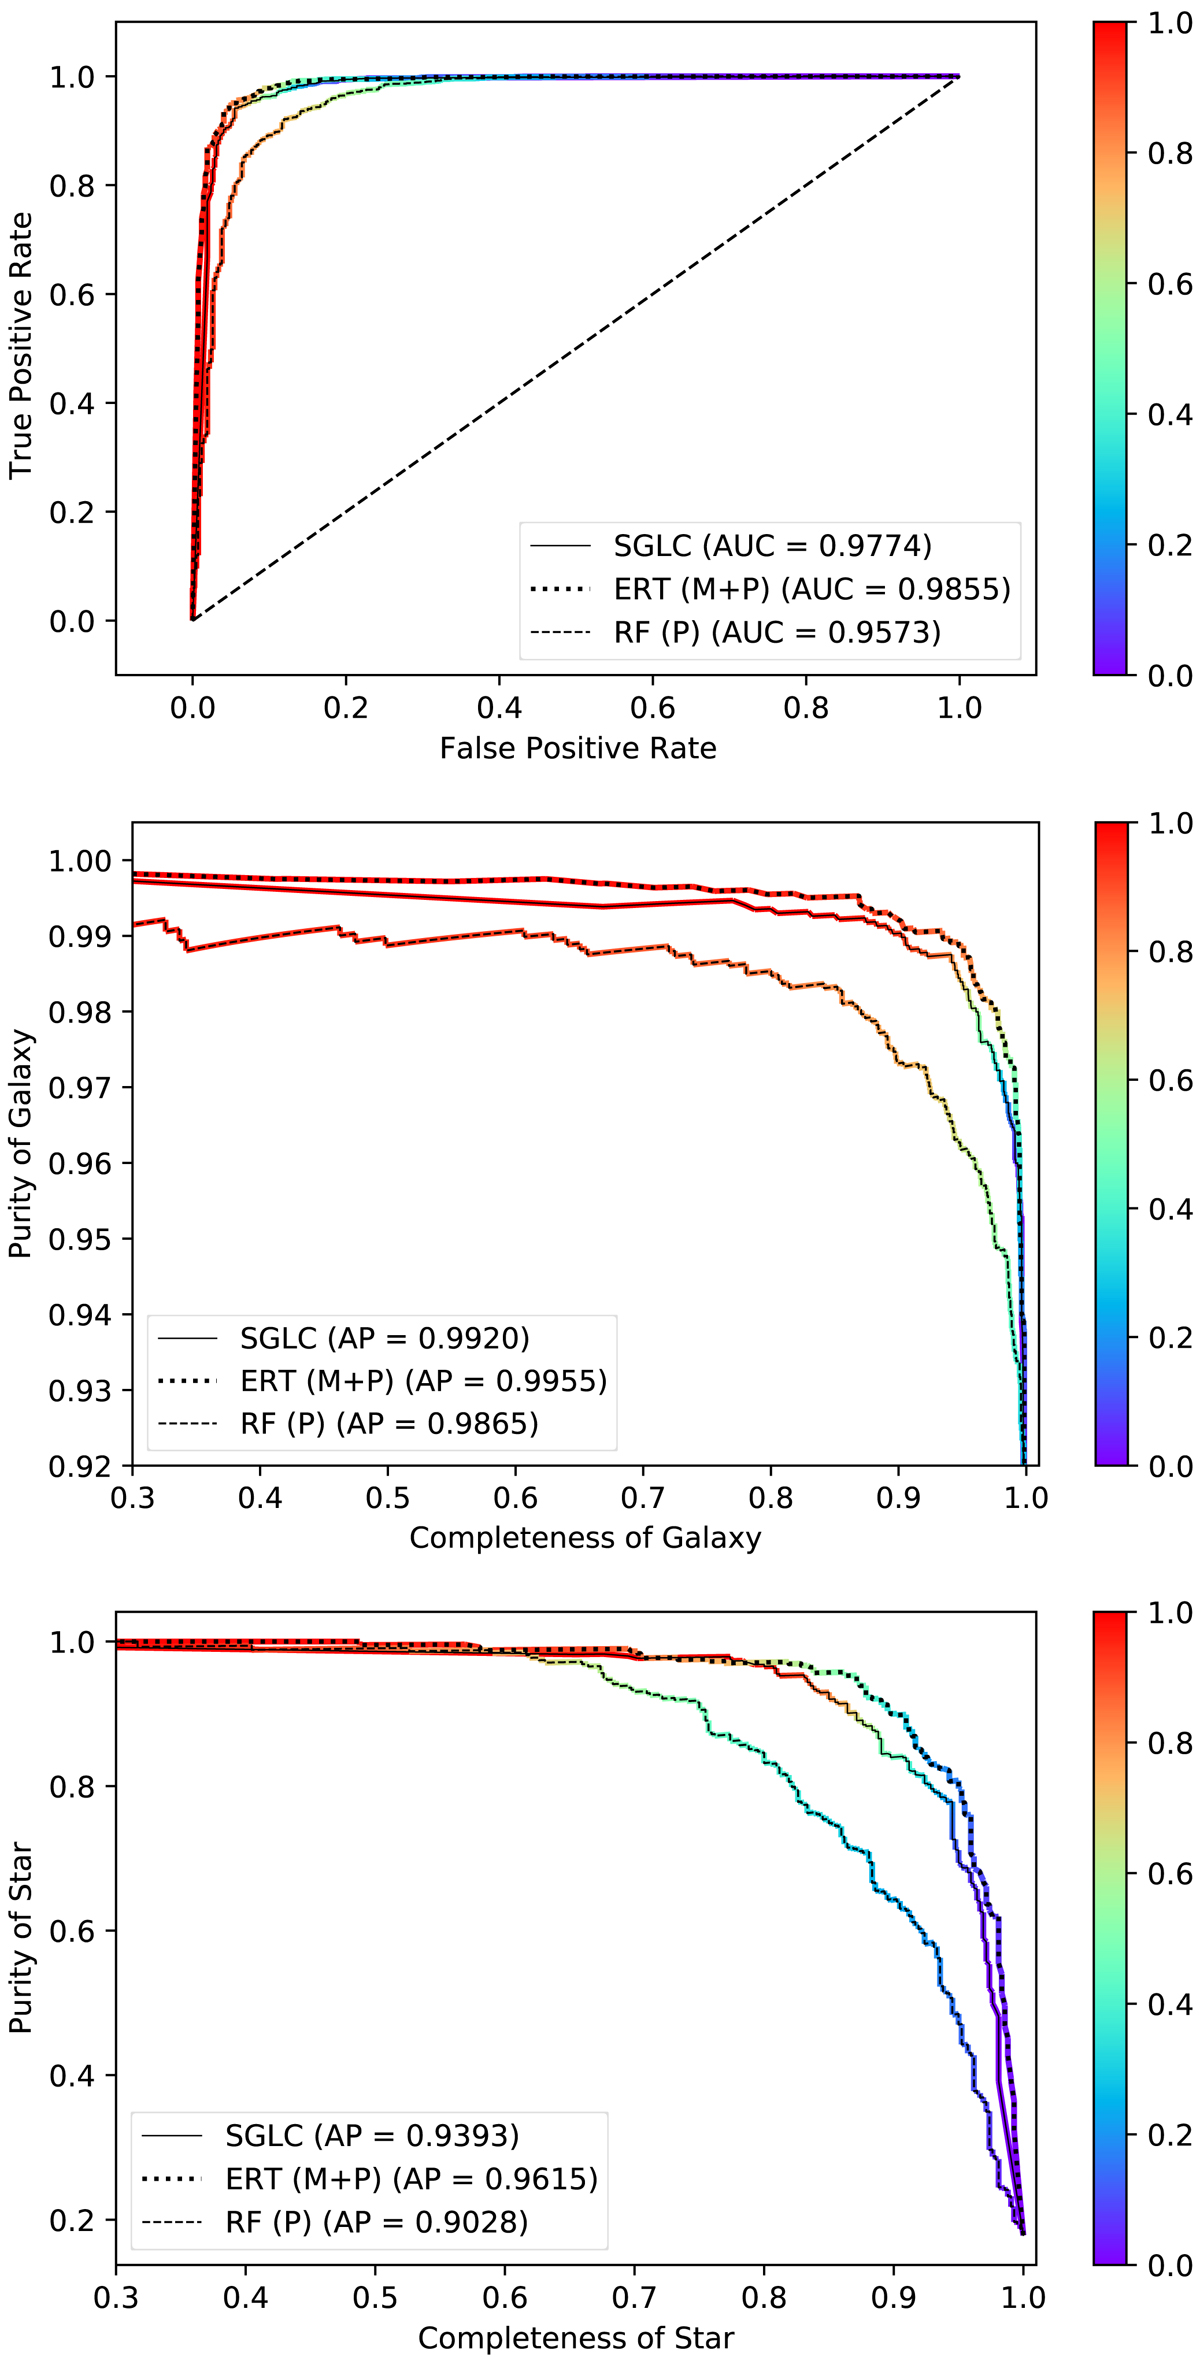
ROC curve (top panel) and purity curve for galaxies (middle panel) and stars (bottom panel) for RF (no morphology), ERT (with morphology), and SGLC for sources in the magnitude range 15 ≤ r ≤ 23.5. The color-coding indicates the probability threshold pcut. The axes ranges are varied in order to better show the curves.
Current usage metrics show cumulative count of Article Views (full-text article views including HTML views, PDF and ePub downloads, according to the available data) and Abstracts Views on Vision4Press platform.
Data correspond to usage on the plateform after 2015. The current usage metrics is available 48-96 hours after online publication and is updated daily on week days.
Initial download of the metrics may take a while.