Fig. 9.
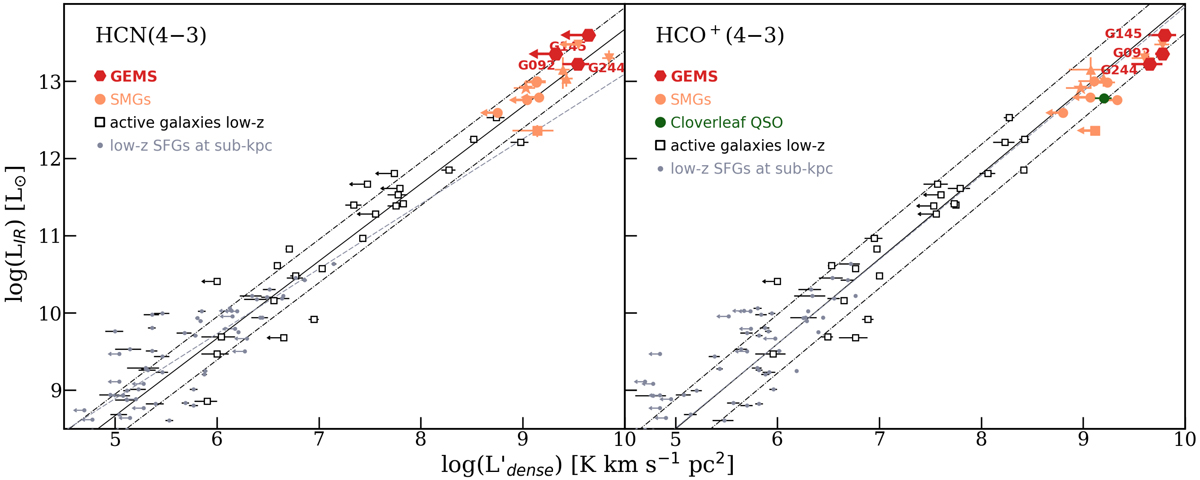
Scaling relations between the total infrared luminosities and the line luminosities of dense-gas tracers. The positions of the GEMS (red points) are compared with the low-redshift relations inferred for a diverse sample of normal blue star-forming galaxies, starbursts, and ULIRGs, and some AGN-dominated sources (black squares, Zhang et al. 2014). Solid and dashed-dotted black lines show their best-fit relations and the ±1σ scatter, respectively. The relations obtained in Tan et al. (2018) for six nearby star-forming galaxies resolved at sub-kpc (gray points) appear as gray dotted lines. The HCN and HCO+ luminosities of the GEMS are plotted for J = 4–3, after correcting LIR for μdust and ![]() for μgas, the magnification factors of the dust and gas components listed in C18. For PLCK_G244.8+54.9, we plot the measured J = 4–3 line luminosities, while for PLCK_G092.5+42.9 and PLCK_G145.2+50.9, we convert the J = 5–4 line luminosities to J = 4–3 using measurements in the circumnuclear disk near the Galactic center (see text, Mills et al. 2013). Previous detections and upper limits of high-redshift sources are plotted as filled symbols and include dusty star-forming galaxies from a subset of the SPT sample (orange circles, Béthermin et al. 2018), the stacking analysis of SPT sources (orange stars, Spilker et al. 2014), four H-ATLAS lensed SMGs (SDP9 and SDP11 as orange triangles, Oteo et al. 2017 and Yang 2017, NCv1.143 and G09v1.97 as upside-down triangles), and the Cosmic Eyelash (orange squares, Danielson et al. 2011). We also show the Cloverleaf QSO (green circle, Riechers et al. 2011). Measurements taken from the literature for J = 5–4 or J = 3–2 were converted to J = 4–3 in the same way as for the GEMS, and strongly lensed sources were corrected for the magnification factors.
for μgas, the magnification factors of the dust and gas components listed in C18. For PLCK_G244.8+54.9, we plot the measured J = 4–3 line luminosities, while for PLCK_G092.5+42.9 and PLCK_G145.2+50.9, we convert the J = 5–4 line luminosities to J = 4–3 using measurements in the circumnuclear disk near the Galactic center (see text, Mills et al. 2013). Previous detections and upper limits of high-redshift sources are plotted as filled symbols and include dusty star-forming galaxies from a subset of the SPT sample (orange circles, Béthermin et al. 2018), the stacking analysis of SPT sources (orange stars, Spilker et al. 2014), four H-ATLAS lensed SMGs (SDP9 and SDP11 as orange triangles, Oteo et al. 2017 and Yang 2017, NCv1.143 and G09v1.97 as upside-down triangles), and the Cosmic Eyelash (orange squares, Danielson et al. 2011). We also show the Cloverleaf QSO (green circle, Riechers et al. 2011). Measurements taken from the literature for J = 5–4 or J = 3–2 were converted to J = 4–3 in the same way as for the GEMS, and strongly lensed sources were corrected for the magnification factors.
Current usage metrics show cumulative count of Article Views (full-text article views including HTML views, PDF and ePub downloads, according to the available data) and Abstracts Views on Vision4Press platform.
Data correspond to usage on the plateform after 2015. The current usage metrics is available 48-96 hours after online publication and is updated daily on week days.
Initial download of the metrics may take a while.