Fig. 7.
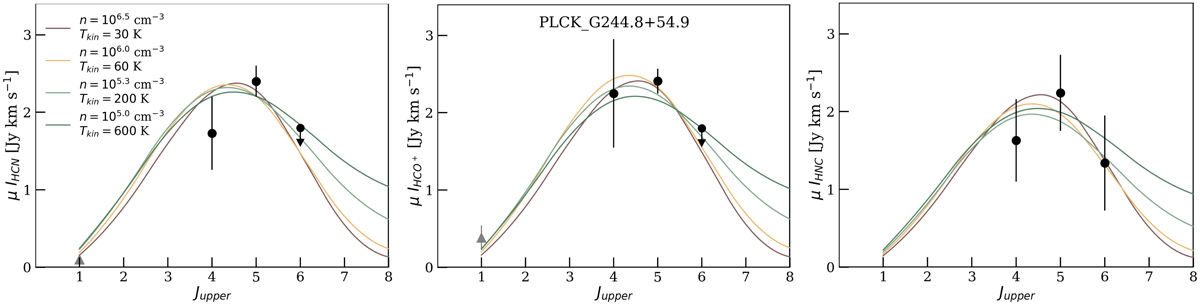
HCN, HCO+, and HNC SLEDs of PLCK_G244.8+54.9 (black points). Gray triangles in the lower left of the first two panels refer to the dense-gas mid-J to J = 1–0 flux ratios in the local ULIRG Arp 220 (Imanishi et al. 2007; Greve et al. 2009), after normalizing to the HCN(4–3) and HCO+(4–3) line fluxes in PLCK_G244.8+54.9. Colored curves show a range of solutions to our collisional excitation models with RADEX, combining the spatially-integrated intensity ratios of HCN, HCO+, and HNC. These curves fit the three SLEDs reasonably well and illustrate the n–Tkin parameter degeneracies shown in more detail in Fig. 8. Lowering flux uncertainties and covering additional dense-gas transitions around the peak would improve the constraints.
Current usage metrics show cumulative count of Article Views (full-text article views including HTML views, PDF and ePub downloads, according to the available data) and Abstracts Views on Vision4Press platform.
Data correspond to usage on the plateform after 2015. The current usage metrics is available 48-96 hours after online publication and is updated daily on week days.
Initial download of the metrics may take a while.