Fig. 6.
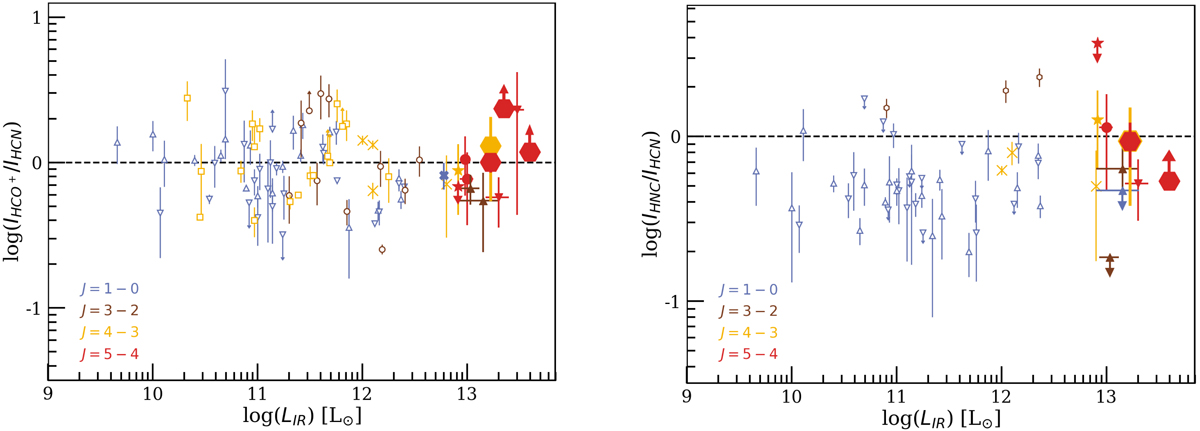
Line ratios of high-density tracer molecules measured in the GEMS as a function of the intrinsic IR luminosity. The quantity LIR is integrated over the 8–1000 μm range and, for gravitationally lensed sources, error bars include uncertainties on the magnification factors. Left: HCO+ to HCN flux ratios, with the GEMS shown as large hexagons. Symbols are color-coded according to the rotational levels of both transitions. The comparison samples include both low- (z < 0.1, empty symbols) and high-redshift (z ≳ 1.5, filled symbols) sources. We show the local samples of LIRGs and ULIRGs from Graciá-Carpio et al. (2008, brown circles), Baan et al. (2008, blue upside-down triangles), and Costagliola et al. (2011, blue upside-up triangles), as well as the normal star-forming galaxies and ULIRGs from Zhang et al. (2014, yellow squares). Local ULIRGs with strong energy contributions from dust-obscured AGN of Imanishi & Nakanishi (2014) appear as yellow crosses. High-redshift line ratios include individual lensed SMGs from the H-ATLAS (triangles, Oteo et al. 2017; Yang 2017) and SPT (circles, Béthermin et al. 2018) surveys, the stack of SPT SMGs (stars, Spilker et al. 2014, taking the average magnification factor over the sample), and the Cloverleaf QSO (blue cross, Riechers et al. 2006). Right: HNC to HCN flux ratios, using similar samples and symbols as above. In this panel, the brown hexagons show a few local starbursts from Aalto et al. (2007).
Current usage metrics show cumulative count of Article Views (full-text article views including HTML views, PDF and ePub downloads, according to the available data) and Abstracts Views on Vision4Press platform.
Data correspond to usage on the plateform after 2015. The current usage metrics is available 48-96 hours after online publication and is updated daily on week days.
Initial download of the metrics may take a while.