Fig. 5.
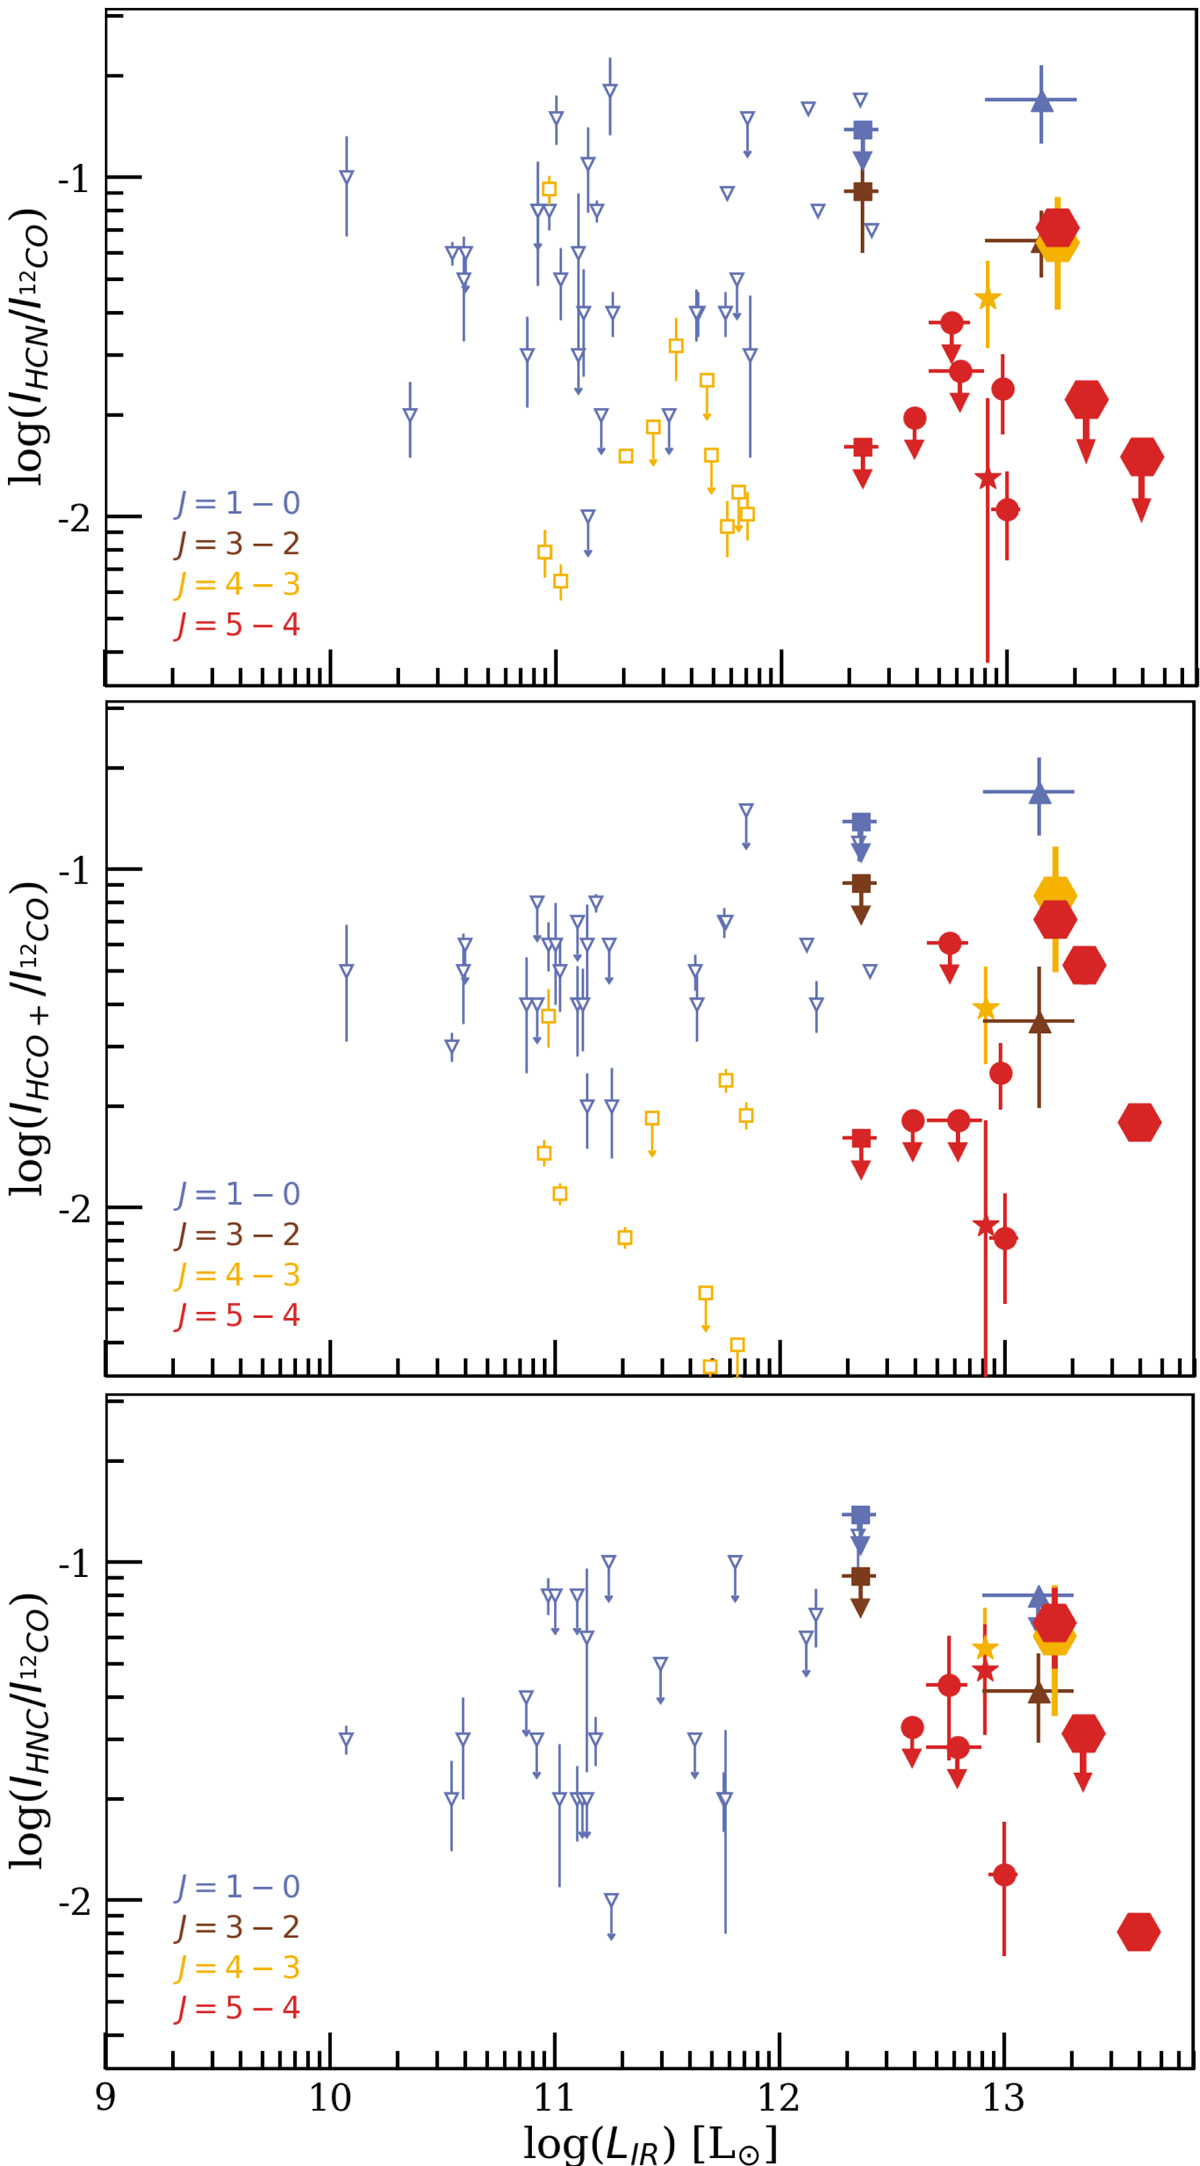
Line ratios between dense-gas tracers and CO as a function of the intrinsic LIR. Comparison samples are shown with the same symbols as in Fig. 6. In particular, the line ratios of local LIRGs and ULIRGs are taken from Baan et al. (2008, J = 1–0 transitions, blue triangles). The additional filled squares show HCN(3–2) in the Cosmic Eyelash and other upper flux density limits presented in Danielson et al. (2011). The CO(4–3) fluxes of the local star-forming galaxies and ULIRGs of Zhang et al. (2014, yellow squares) are taken from Rosenberg et al. (2015).
Current usage metrics show cumulative count of Article Views (full-text article views including HTML views, PDF and ePub downloads, according to the available data) and Abstracts Views on Vision4Press platform.
Data correspond to usage on the plateform after 2015. The current usage metrics is available 48-96 hours after online publication and is updated daily on week days.
Initial download of the metrics may take a while.