Fig. 4.
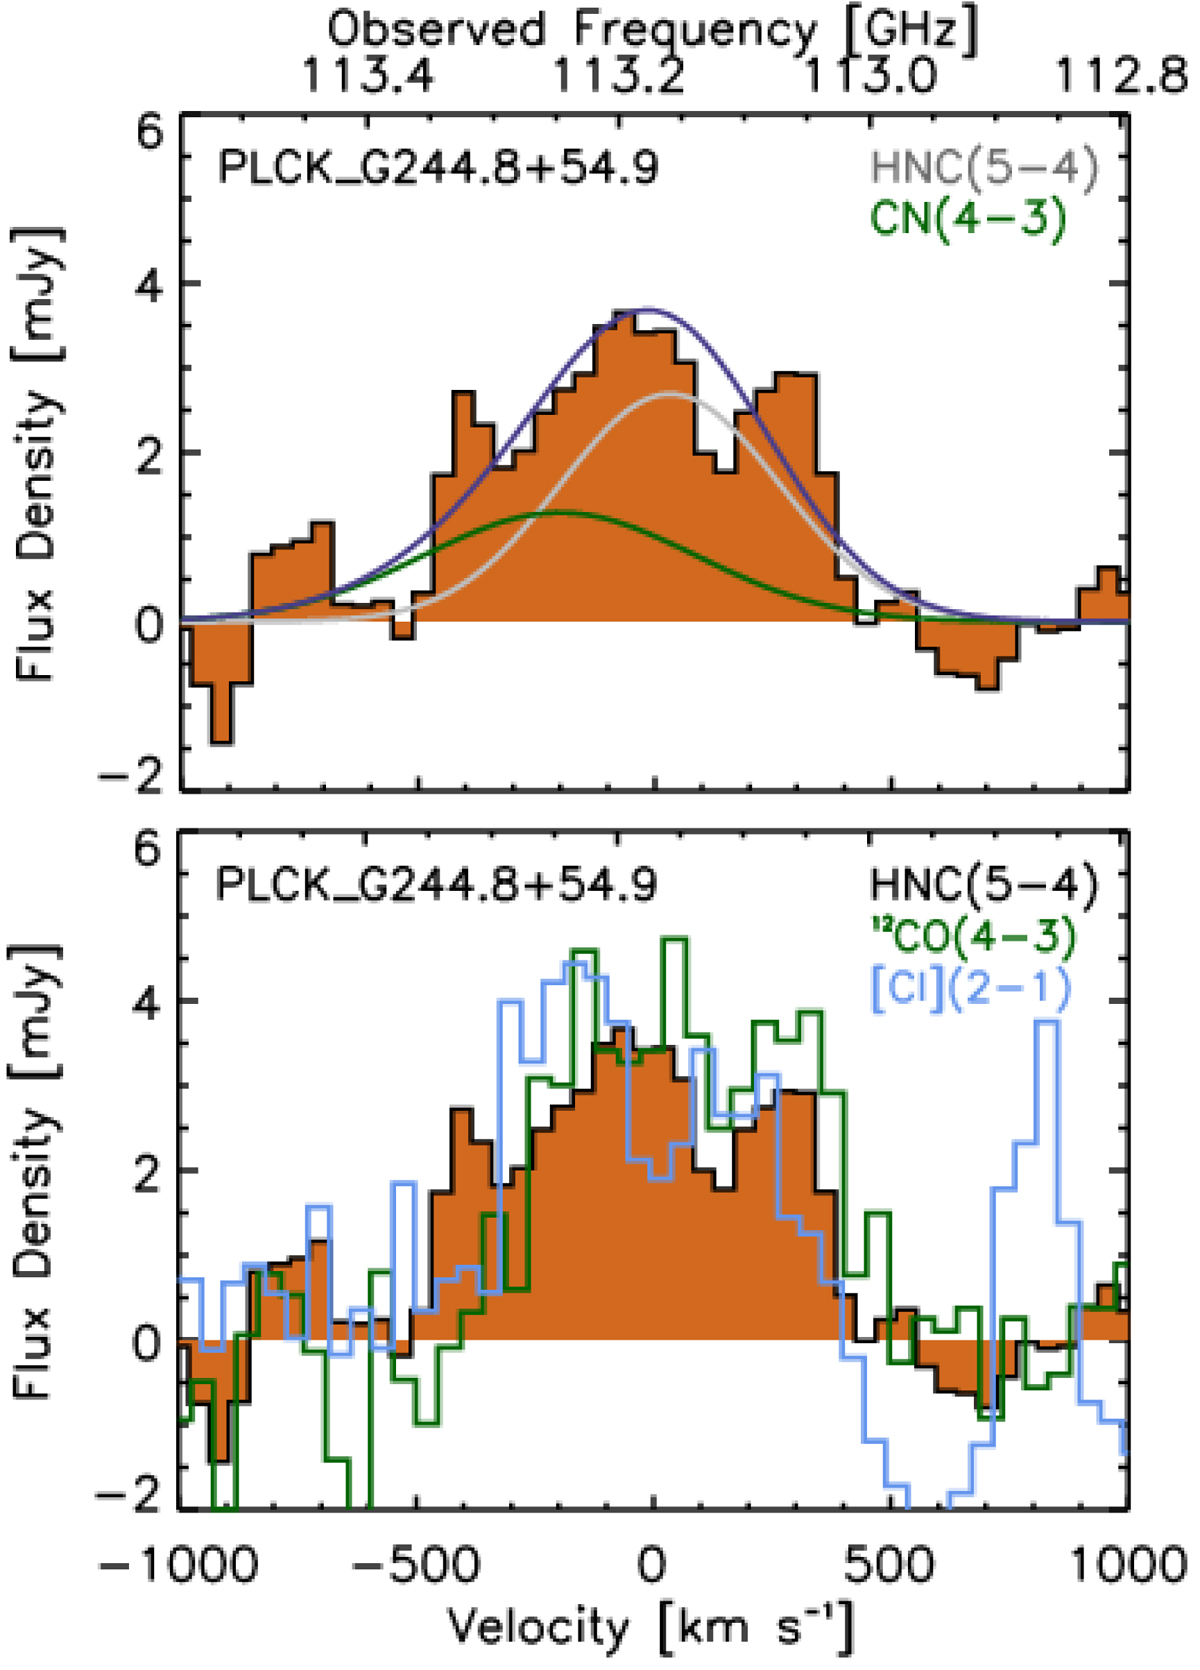
Spatially integrated ALMA spectrum of HNC(5–4) in PLCK_G244.8+54.9, with a spectral channel width of 42 km s−1. Top: dark blue line shows the best-fit profile, with the deblended HNC(5–4) and CN(4–3) emission lines plotted in grey and green, respectively (see Sect. 3.3). Bottom: comparison of the line profile with those of CO(4–3) and [C I](2–1).
Current usage metrics show cumulative count of Article Views (full-text article views including HTML views, PDF and ePub downloads, according to the available data) and Abstracts Views on Vision4Press platform.
Data correspond to usage on the plateform after 2015. The current usage metrics is available 48-96 hours after online publication and is updated daily on week days.
Initial download of the metrics may take a while.