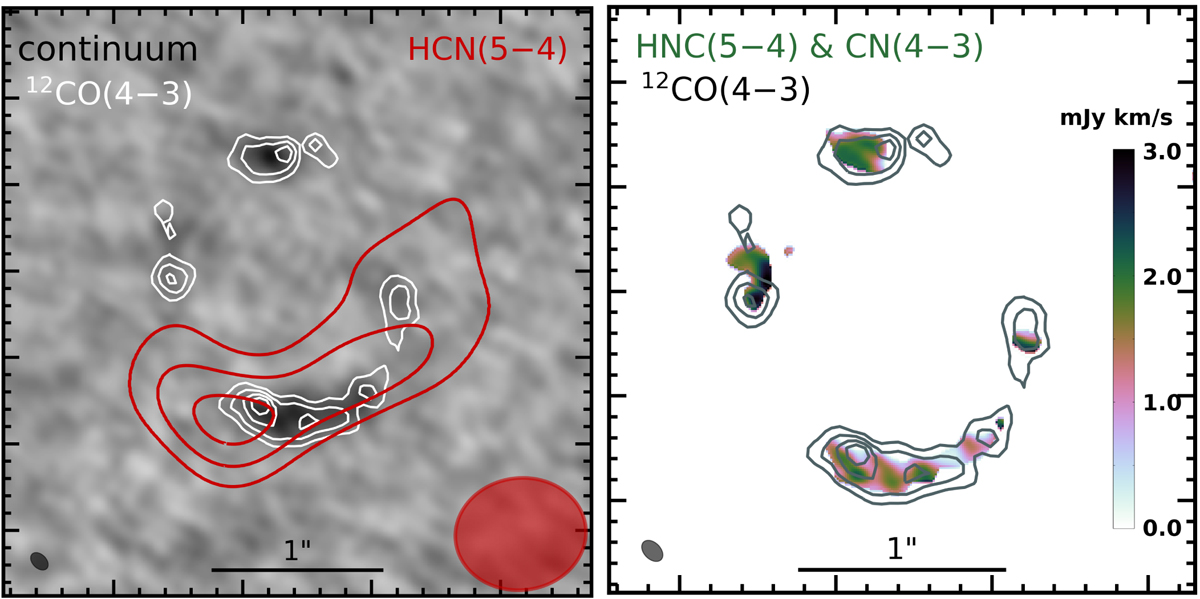
Fig. 3.

Left: velocity-integrated HCN(5–4) map of PLCK_G244.8+54.9 from ALMA (red contours) with a beamsize of 0.78″ × 0.67″ at PA = −83.6° (red ellipse in the lower-right corner), compared with the CO(4–3) line emission (white contours) and 3-mm dust continuum (grey background) at 0.1″ resolution from C17a. Contour levels are 4σ, 6σ, 8σ (red) and 3σ, 6σ, 9σ (white). Right: zoom onto the morphology of the velocity-integrated HNC(5–4) line emission blended with CN(4–3) (see Sect. 3.3). The black contours correspond to the white ones in the left panel. Local velocity-integrated flux densities of the blended HNC(5–4) line are shown as a color map, with the same beamsize of 0.119″ × 0.081″ as CO(4–3) (grey ellipse in the lower-left corner).
Current usage metrics show cumulative count of Article Views (full-text article views including HTML views, PDF and ePub downloads, according to the available data) and Abstracts Views on Vision4Press platform.
Data correspond to usage on the plateform after 2015. The current usage metrics is available 48-96 hours after online publication and is updated daily on week days.
Initial download of the metrics may take a while.


