Fig. 2.
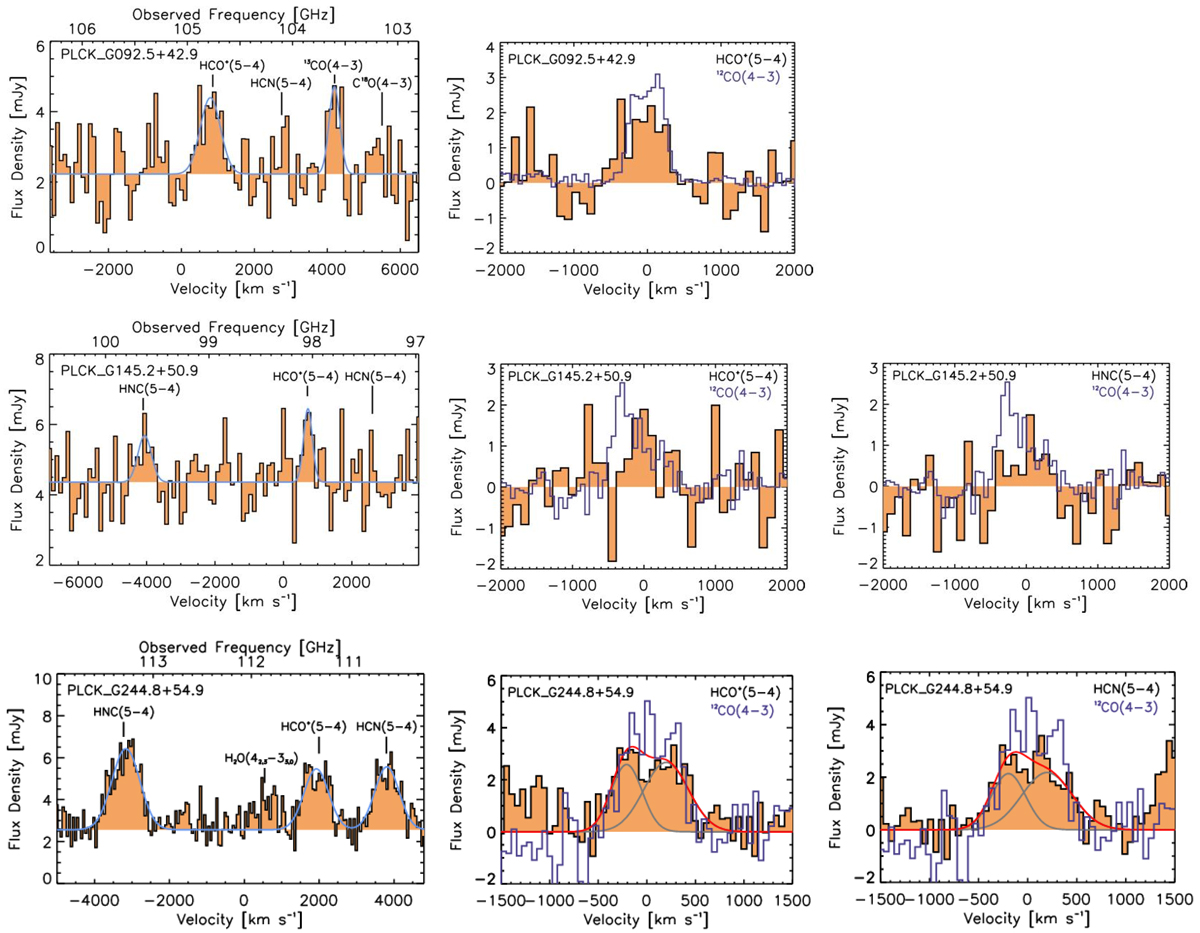
Spatially integrated NOEMA spectra of emission lines from dense-gas tracers binned to 100 km s−1 resolution. Left: best-fit Gaussian functions obtained with the mpfit algorithm for all transitions detected at > 3σ (blue curves), together with the continuum. Middle and right: profiles of individual lines compared with those of 12CO(4–3) (blue lines). CO spectra are rescaled arbitrarily and shifted according to the best spectroscopic redshifts from C18. For PLCK_G244.8+54.9, the continuum-subtracted spectra of HCN(5–4) and HCO+(5–4) were also fitted with two Gaussian components by fixing the peak velocities to those measured for CO lines (C18). The best-fit line profiles are plotted as red curves and individual spectral components are overlaid as gray curves.
Current usage metrics show cumulative count of Article Views (full-text article views including HTML views, PDF and ePub downloads, according to the available data) and Abstracts Views on Vision4Press platform.
Data correspond to usage on the plateform after 2015. The current usage metrics is available 48-96 hours after online publication and is updated daily on week days.
Initial download of the metrics may take a while.