Fig. 1.
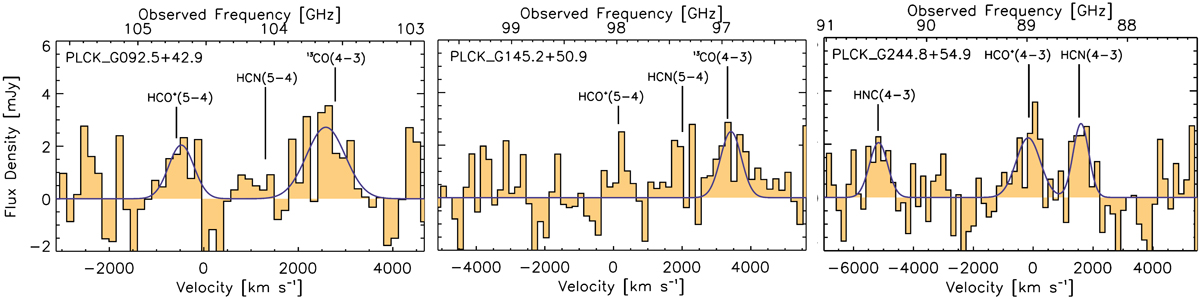
Spatially integrated EMIR spectra of emission lines from high-density tracer molecules observable using a single setup in the 3-mm band. The spectra were continuum-subtracted, binned to 50–55 km s−1 resolution, and lines detected at > 3σ were fitted with single Gaussian functions using the CLASS software package from GILDAS (blue curves). Additional tests were performed to confirm that these detections are real (see details in Sect. 2.1).
Current usage metrics show cumulative count of Article Views (full-text article views including HTML views, PDF and ePub downloads, according to the available data) and Abstracts Views on Vision4Press platform.
Data correspond to usage on the plateform after 2015. The current usage metrics is available 48-96 hours after online publication and is updated daily on week days.
Initial download of the metrics may take a while.