Fig. 11.
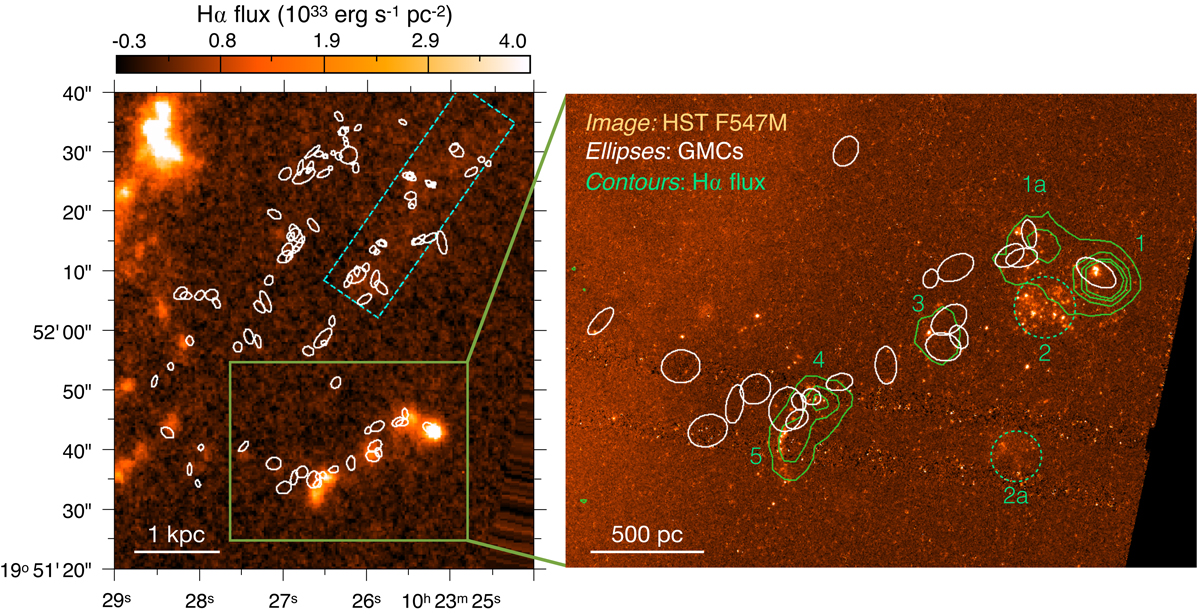
Left panel: Hα image showing intense star formation in the south of the TDG, with white ellipses indicating the position, size, and orientation of GMCs identified with CPROPS; the cyan dashed rectangle marks an area of mildly enhanced Hα emission as discussed in the text. Right panel: HST WFC3/F547M image zoomed on the area marked in the left panel, revealing young stellar clusters in the south of the TDG. White ellipses indicate GMCs and green contours show constant Hα flux (0.8, 2, 3, and 4 × 1033 erg s−1 pc−2). The numbering of regions follows Lisenfeld et al. (2008); the dashed green regions are visible in B band but lack detectable Hα emission.
Current usage metrics show cumulative count of Article Views (full-text article views including HTML views, PDF and ePub downloads, according to the available data) and Abstracts Views on Vision4Press platform.
Data correspond to usage on the plateform after 2015. The current usage metrics is available 48-96 hours after online publication and is updated daily on week days.
Initial download of the metrics may take a while.