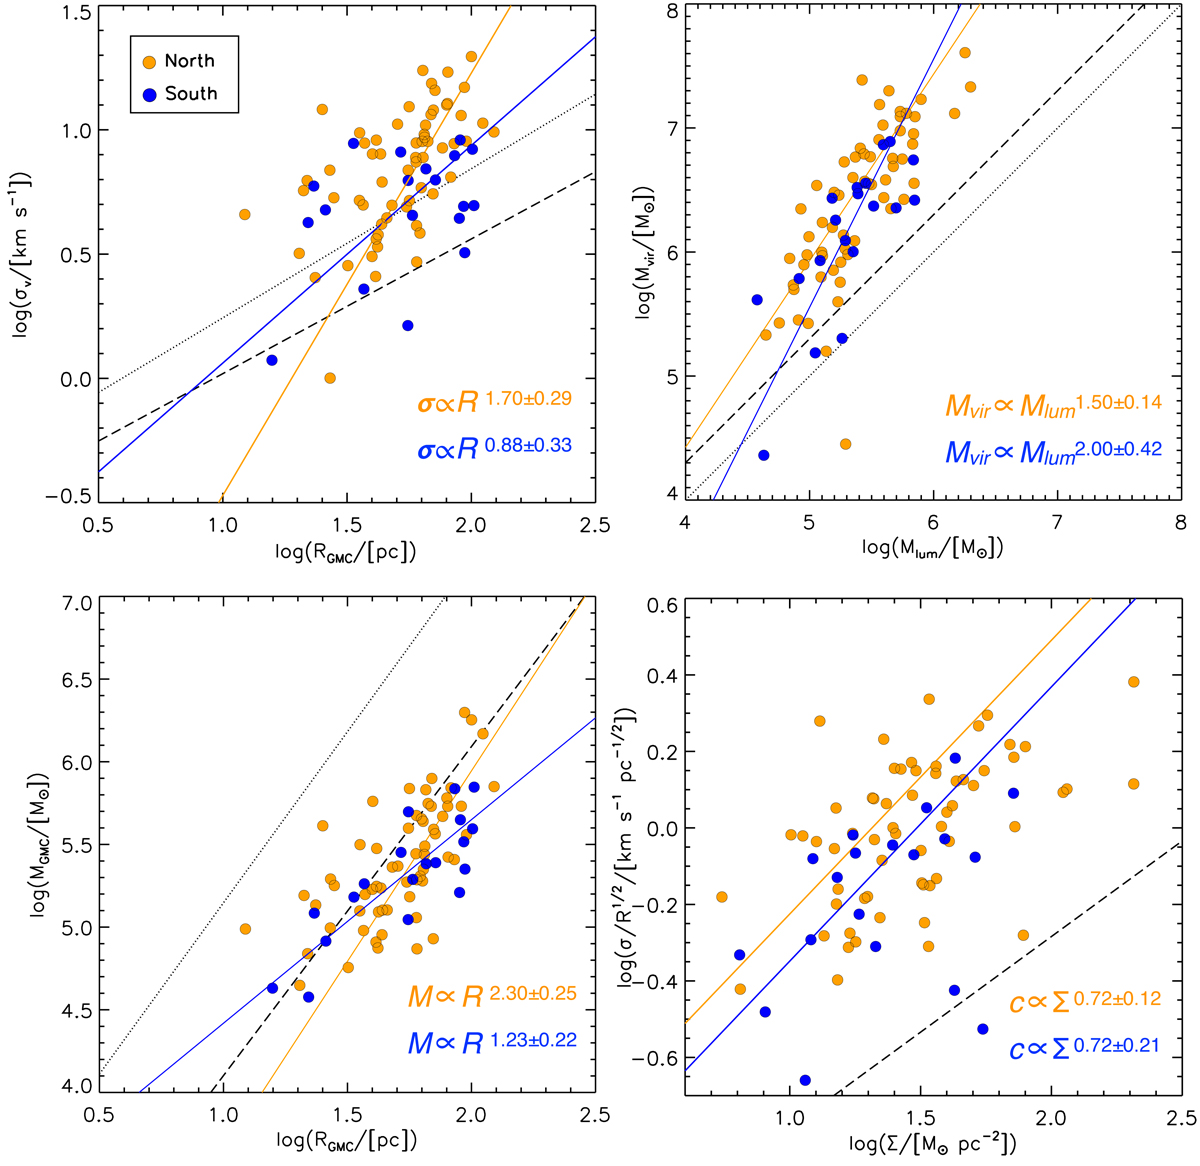
Fig. 10.

Larson’s relations for the ensemble of GMCs identified in the TDG using CPROPS. We differentiate between the quiescent environment in the north (orange points) and the star-forming region in the south (blue points). The solid lines represent the best ODR fits to the data (orange for north, blue for south). Top left panel: size-linewidth relation. The dashed line is the relation for Galactic clouds from Heyer et al. (2001) and the dotted line represents the best fit to extragalactic clouds from Bolatto et al. (2008). Top right panel: virial mass-luminous mass relation. The dotted and dashed lines are the 1:1 and 2:1 relations, respectively. Bottom left panel: size-mass relation. The dashed and dotted lines are the relations for Milky Way clouds from Lombardi et al. (2010) for an extinction threshold of AK = 0.1 and 1.5, respectively. Bottom right panel: Heyer plot showing ![]() as a function of the molecular gas mass surface density; the dashed line is the Galactic relation from Heyer et al. (2001).
as a function of the molecular gas mass surface density; the dashed line is the Galactic relation from Heyer et al. (2001).
Current usage metrics show cumulative count of Article Views (full-text article views including HTML views, PDF and ePub downloads, according to the available data) and Abstracts Views on Vision4Press platform.
Data correspond to usage on the plateform after 2015. The current usage metrics is available 48-96 hours after online publication and is updated daily on week days.
Initial download of the metrics may take a while.


