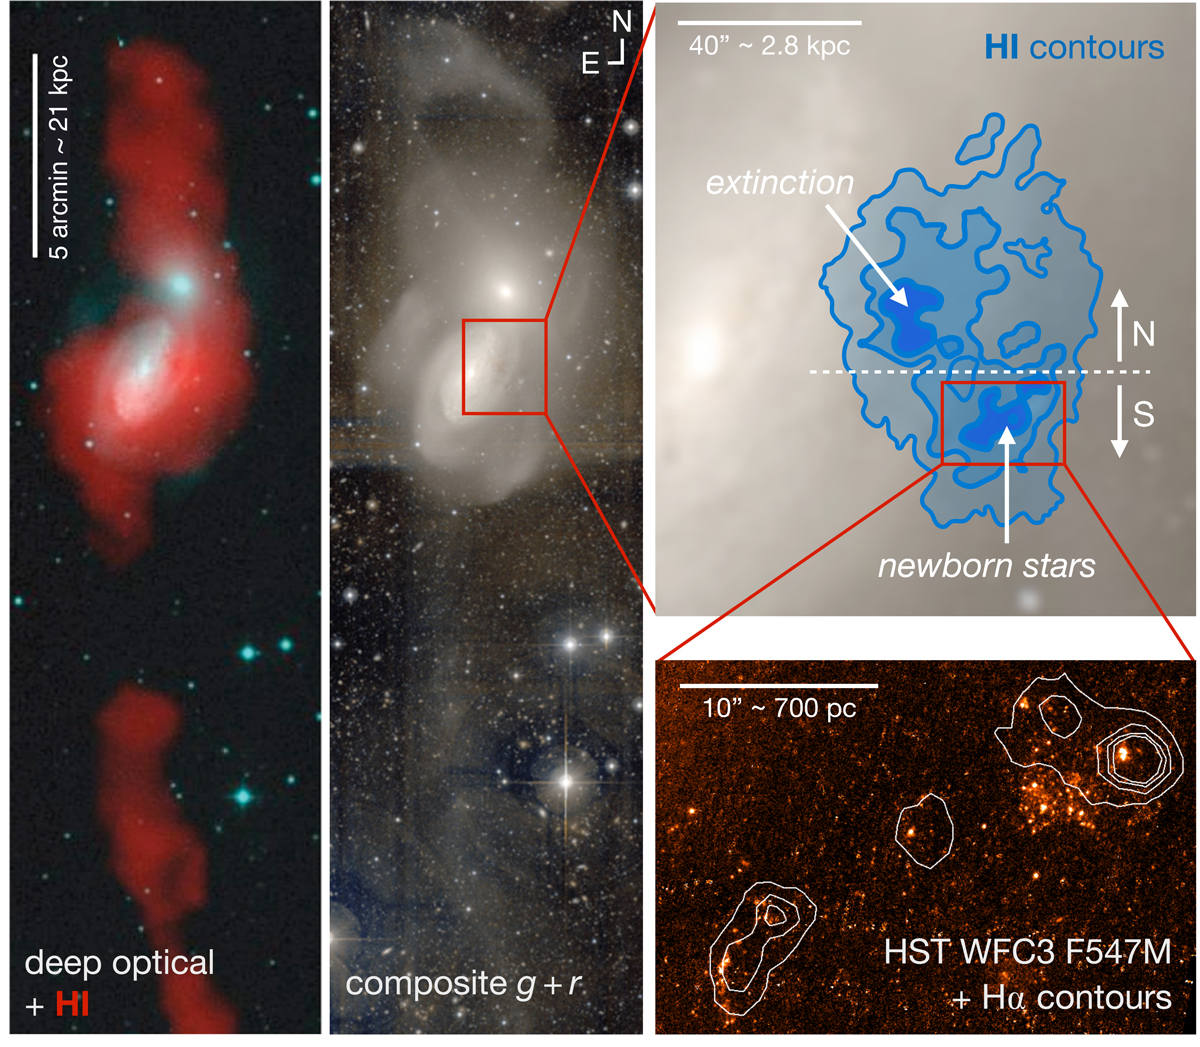
Fig. 1.

Left panel: H I emission in the Arp 94 system (in red) on top of a deep optical image from Mundell et al. (1995b). Central panel: composite g + r deep optical image from MegaCam/CFHT using an “arcsinh stretch” to emphasise faint emission (Duc et al. 2014). Both the left and central panels come from Appleton et al. (2014). Top-right panel: blow-up of the g + r composite image showing the location of the TDG in H I emission as blue contours, equivalent to an extinction of 0.4, 1.4, 2.4, and 3.4 AB magnitudes, ranging from 4 × 10²⁰ to 4 × 1021 cm−2 (Mundell et al. 2004); the annotations indicate the area where a high optical extinction is seen towards the background galaxy (north-east) and the star-forming region in the south, as well as the demarcation line at Dec = 19° 51′50″ that we apply to distinguish the northern from the southern part of the TDG. Bottom-right panel: star-forming region in the south of the TDG as revealed by young clusters visible in HST WFC3/F547M imaging and Hα emission from Mundell et al. (2004) shown as contours (0.8, 2, 3, and 4 × 1033 erg s−1 pc−2).
Current usage metrics show cumulative count of Article Views (full-text article views including HTML views, PDF and ePub downloads, according to the available data) and Abstracts Views on Vision4Press platform.
Data correspond to usage on the plateform after 2015. The current usage metrics is available 48-96 hours after online publication and is updated daily on week days.
Initial download of the metrics may take a while.


