Fig. 7
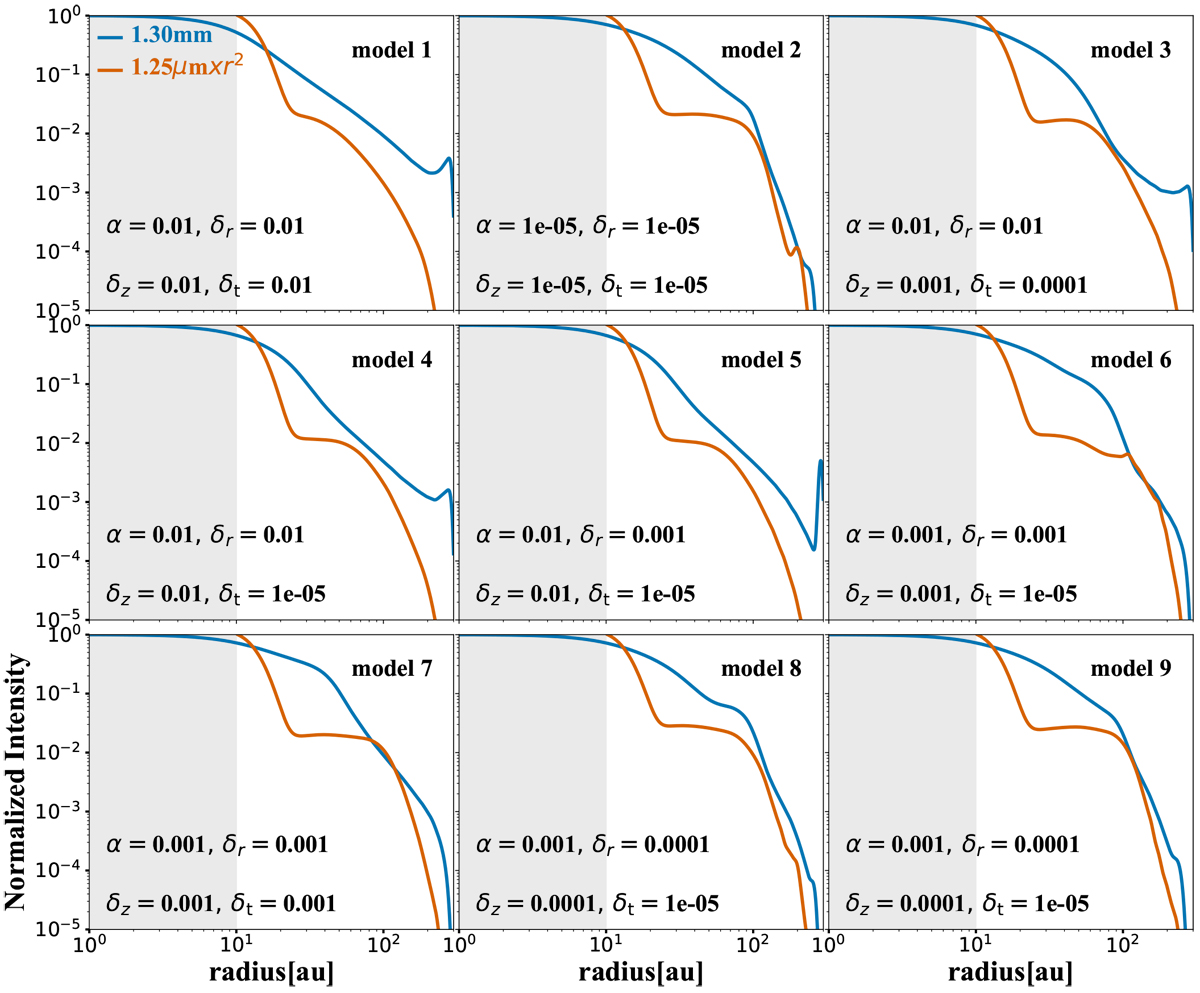
Radial intensity profile of the synthetic images (previously convolved with a Gaussian with an FWHM of 0′′.04 in each case) after radiative transfer calculations assuming the particle density distributions from Fig. 3. The intensity profiles are obtained at 1.25 μm and 1.3 mm. The intensity profile at 1.25 μm is multiplied by r2 to compensate for the stellar irradiation. The gray regions show the typical size of a coronograph or/and saturated inner pixels from typical observations at scattered light. Case of models without bumps.
Current usage metrics show cumulative count of Article Views (full-text article views including HTML views, PDF and ePub downloads, according to the available data) and Abstracts Views on Vision4Press platform.
Data correspond to usage on the plateform after 2015. The current usage metrics is available 48-96 hours after online publication and is updated daily on week days.
Initial download of the metrics may take a while.