Open Access
Fig. 4
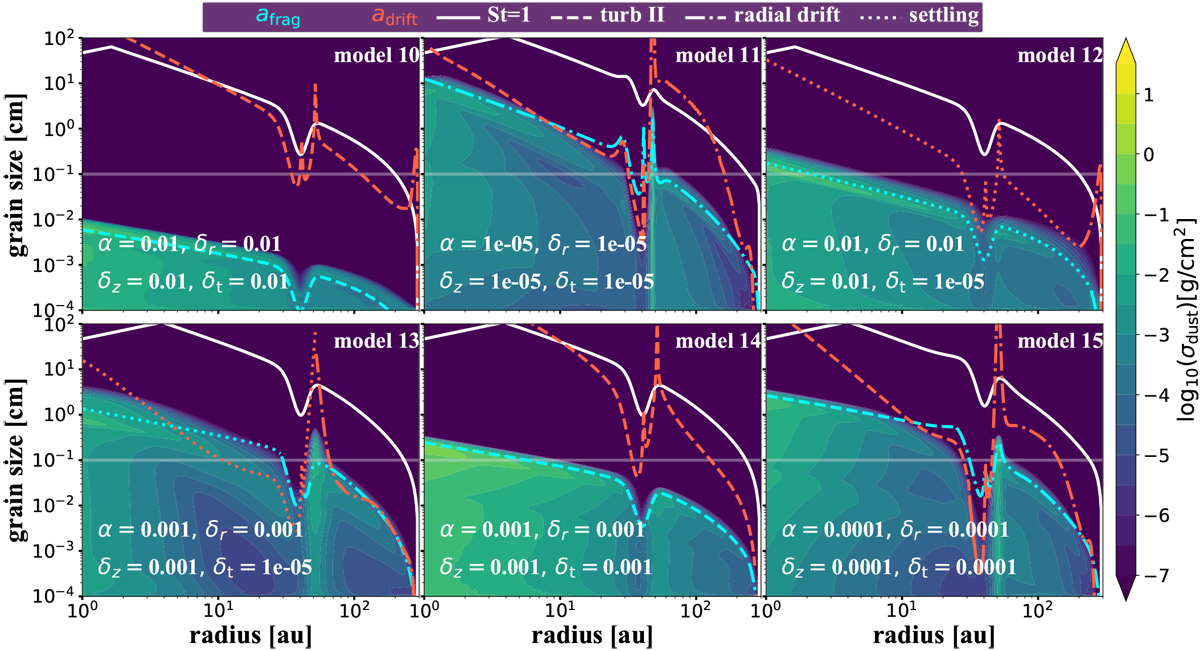
Particle density distribution of the models with a pressure bump in the outer part of the disk (dip located at 40 au) after 1 Myr of evolution. We follow the same procedure as in Fig. 2 for the barriers.
Current usage metrics show cumulative count of Article Views (full-text article views including HTML views, PDF and ePub downloads, according to the available data) and Abstracts Views on Vision4Press platform.
Data correspond to usage on the plateform after 2015. The current usage metrics is available 48-96 hours after online publication and is updated daily on week days.
Initial download of the metrics may take a while.