Fig. 2
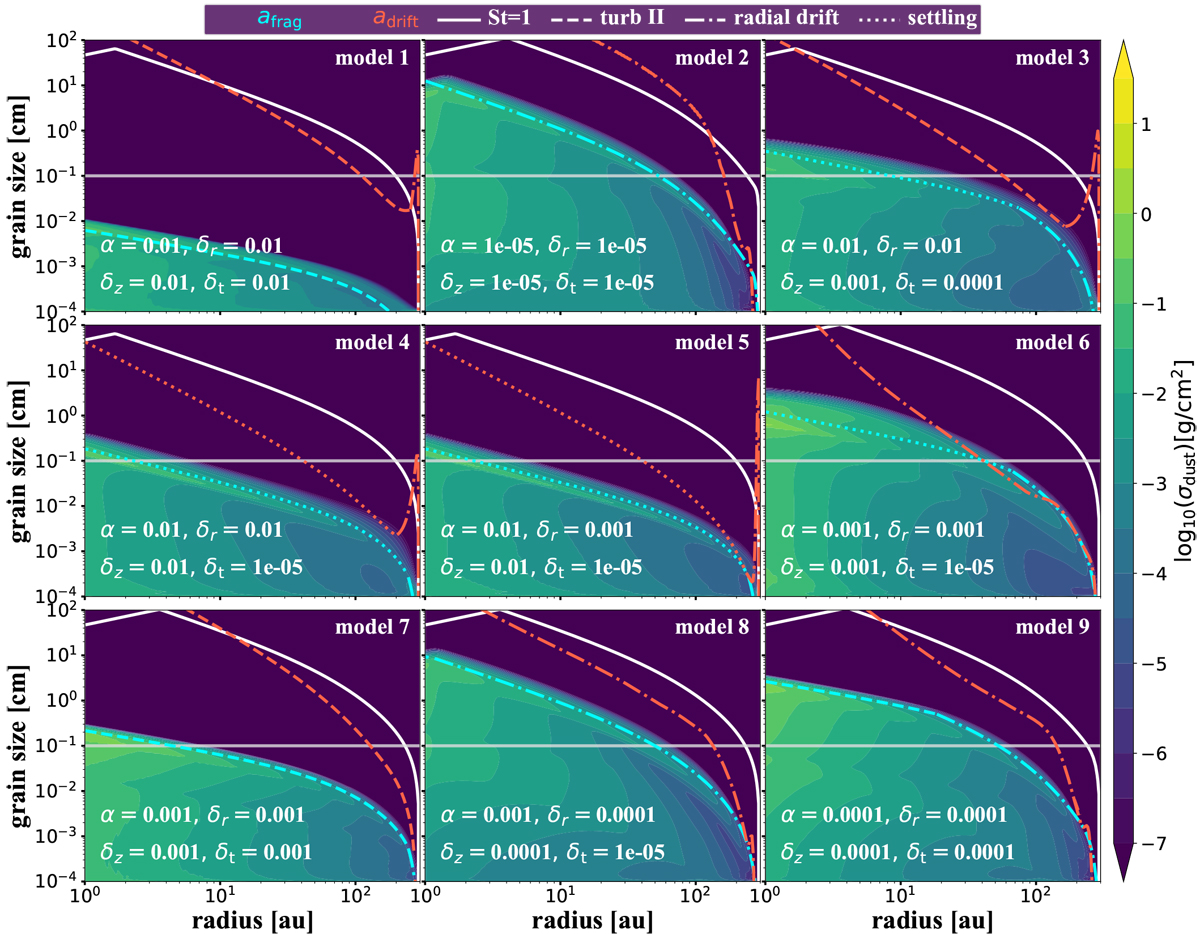
Particle density distribution after 1 Myr of evolution as a function of distance from the star and grain size of the models without any pressure bump (Table 1). The solid white line represents a Stokes number of unity. Cyan and red show the fragmentation (Eq. (A.17)) and drift (Eq. (A.32)) limit. The style of the line shows what dominates the relative velocity: turbulence (Eqs. (A.16) and (A.27)), radial drift (Eqs. (A.10), and (A.24)), and settling (Eqs. (A.15) and (A.25)). We do not include the turbulence I regime or the azimuthal drift because they do not dominate the relative velocities in any case for the shown snapshot. The horizontal gray line shows a = 1 mm, and we call pebbles all particles that are larger than this.
Current usage metrics show cumulative count of Article Views (full-text article views including HTML views, PDF and ePub downloads, according to the available data) and Abstracts Views on Vision4Press platform.
Data correspond to usage on the plateform after 2015. The current usage metrics is available 48-96 hours after online publication and is updated daily on week days.
Initial download of the metrics may take a while.