Fig. 4.
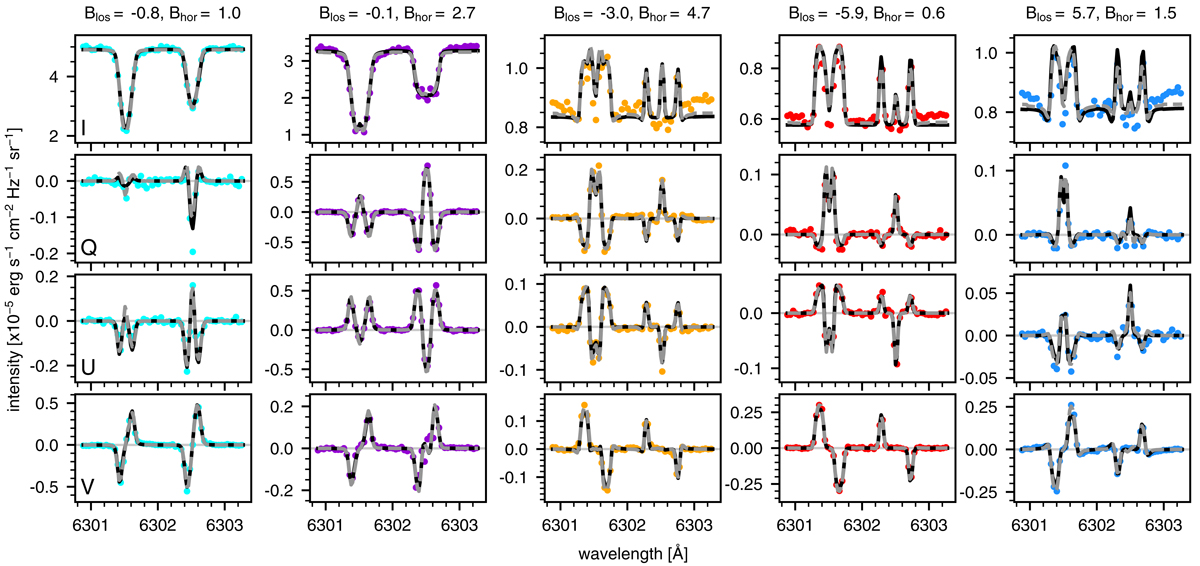
Fe I 6301.5 Å and 6302.5 Å profiles from observations and (non-)LTE inversions. Each column shows (from top to bottom) Stokes I, Q, U and V profiles as observed (coloured dots) and as fitted in LTE (grey dashed line) and in non-LTE (solid black line). The colour coding corresponds to the identically coloured plus markers in the left-hand panels of Fig. 2. The numbers above each column indicate the non-LTE-inferred Blos and Bhor at log τ500 = −0.5.
Current usage metrics show cumulative count of Article Views (full-text article views including HTML views, PDF and ePub downloads, according to the available data) and Abstracts Views on Vision4Press platform.
Data correspond to usage on the plateform after 2015. The current usage metrics is available 48-96 hours after online publication and is updated daily on week days.
Initial download of the metrics may take a while.