Free Access
Fig. 12.
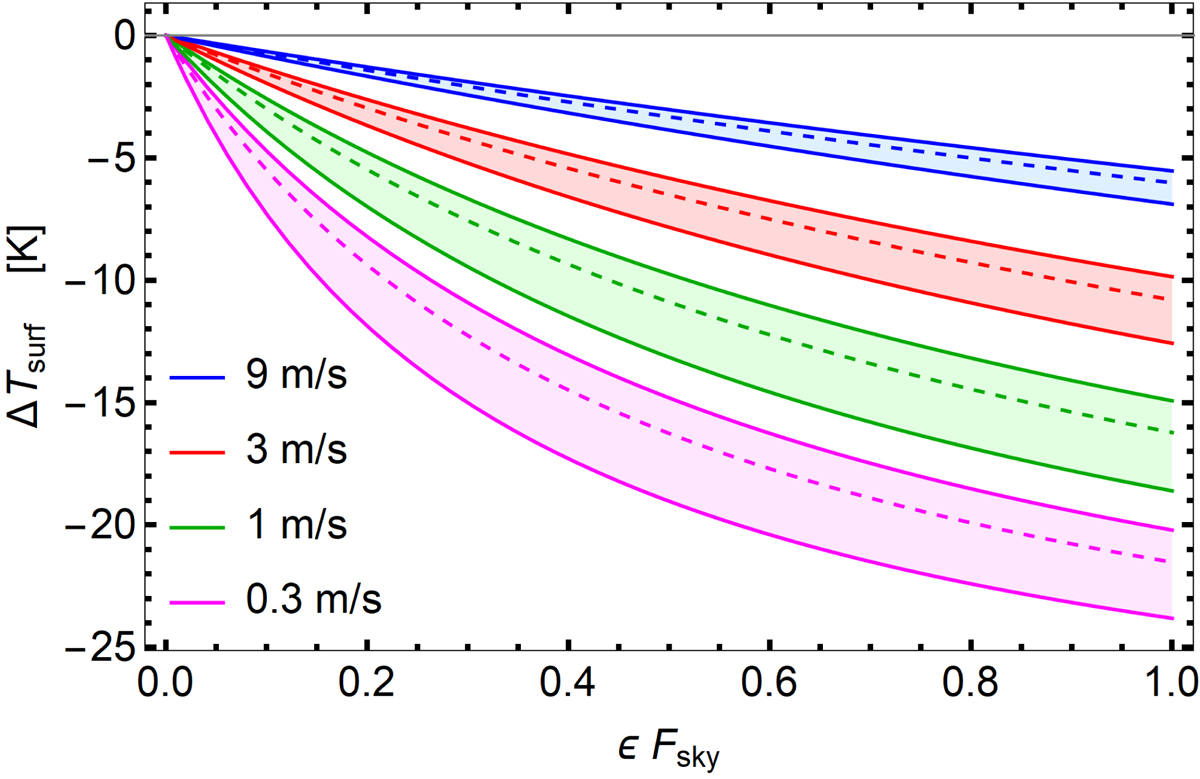
Steady-state surface subcooling ΔTsurf as a function of ![]() for four different local air speeds v. The upper edges of the colored fans correspond to s = 1.26 m, the dashed lines to s = 1.88 m, and the lower edges to s = 4.3 m, respectively.
for four different local air speeds v. The upper edges of the colored fans correspond to s = 1.26 m, the dashed lines to s = 1.88 m, and the lower edges to s = 4.3 m, respectively.
Current usage metrics show cumulative count of Article Views (full-text article views including HTML views, PDF and ePub downloads, according to the available data) and Abstracts Views on Vision4Press platform.
Data correspond to usage on the plateform after 2015. The current usage metrics is available 48-96 hours after online publication and is updated daily on week days.
Initial download of the metrics may take a while.