Fig. 7.
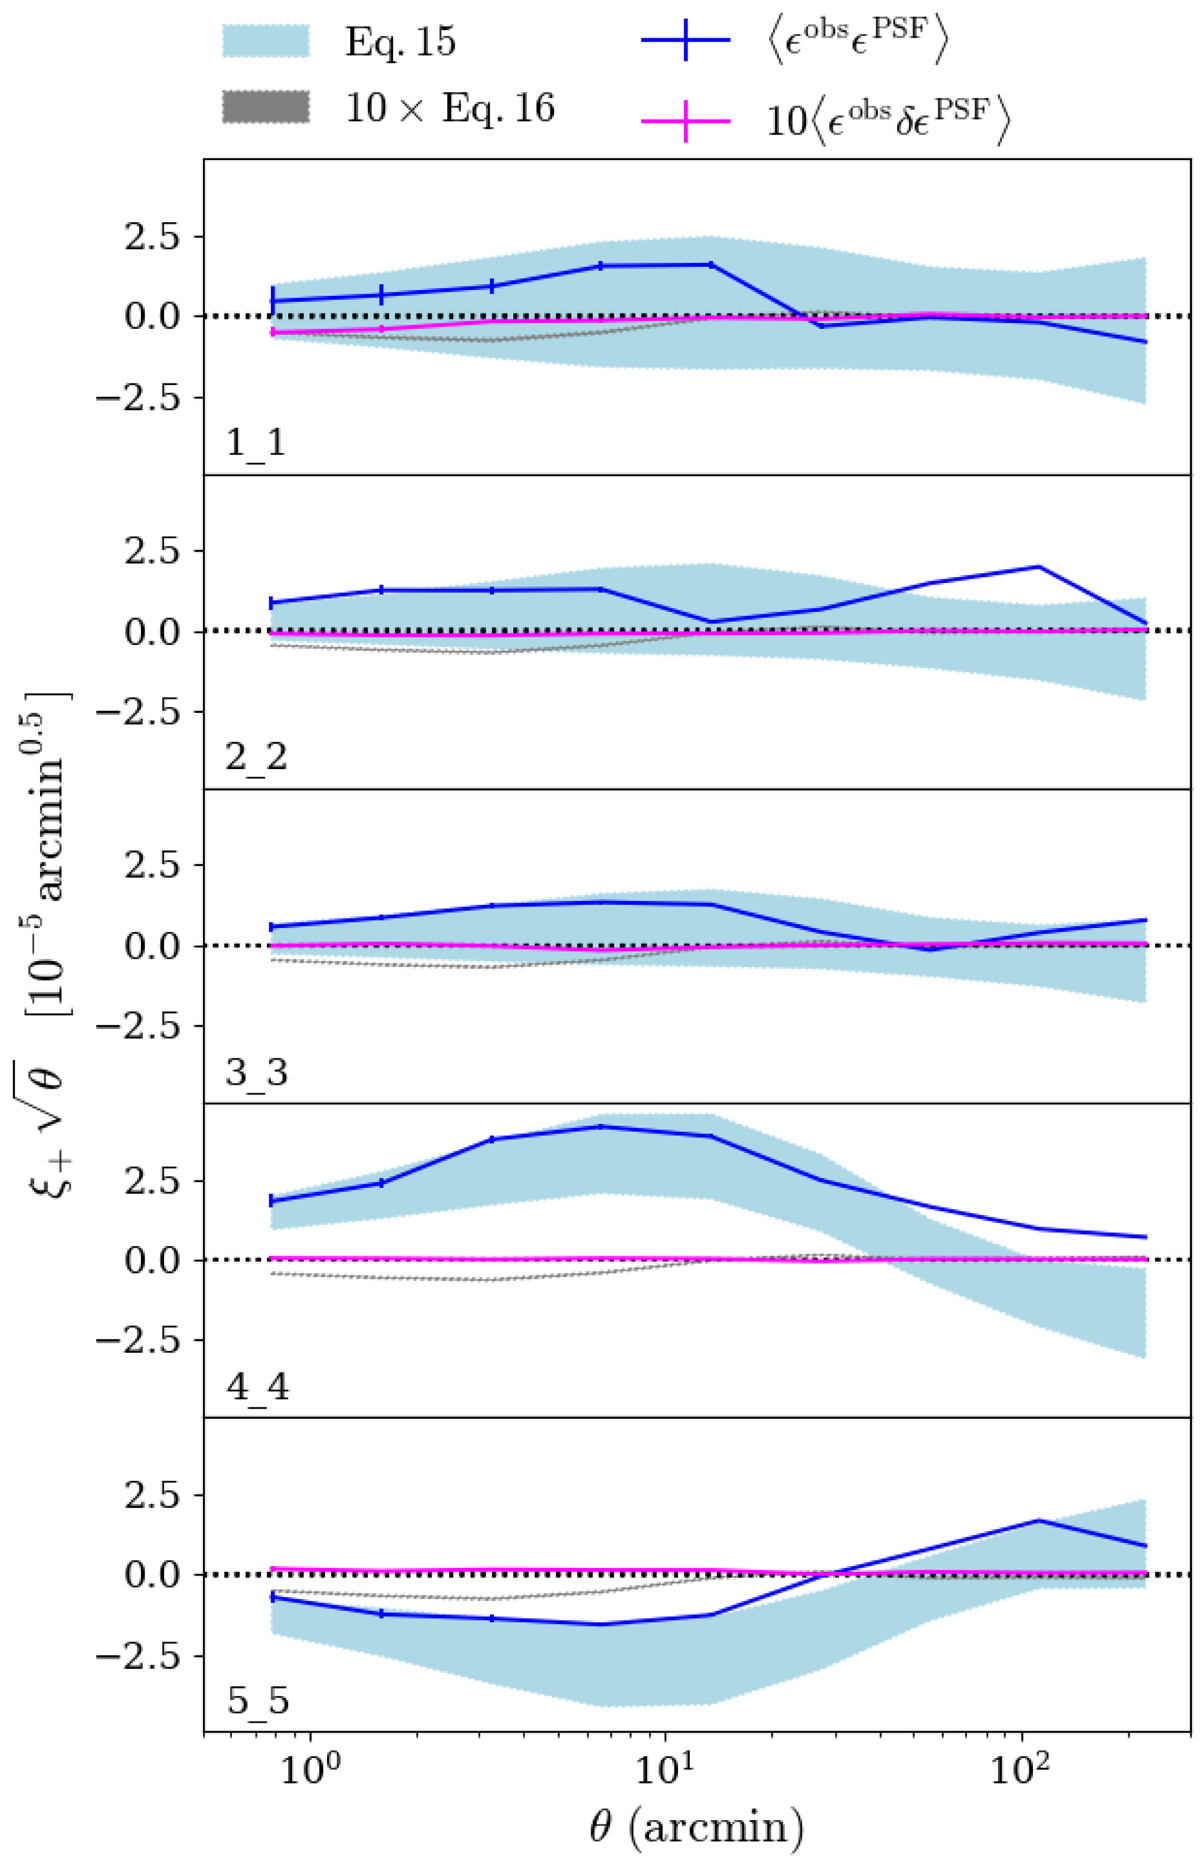
Comparison of two star-galaxy cross-correlation functions with their corresponding linear systematics model predictions (Eqs. (15) and (16)) for the five tomographic bins. The star-galaxy cross correlation function ![]() (dark blue) is in reasonable agreement with the model (blue bar), where the width of the model reflects the 2σ uncertainty. The residual star-galaxy cross correlation function
(dark blue) is in reasonable agreement with the model (blue bar), where the width of the model reflects the 2σ uncertainty. The residual star-galaxy cross correlation function ![]() (shown pink), and corresponding model (grey), are scaled by a factor of ten in order to display the measurements on the same scale. We also scale the correlation functions by
(shown pink), and corresponding model (grey), are scaled by a factor of ten in order to display the measurements on the same scale. We also scale the correlation functions by ![]() to aid visualisation of the large-scale signal.
to aid visualisation of the large-scale signal.
Current usage metrics show cumulative count of Article Views (full-text article views including HTML views, PDF and ePub downloads, according to the available data) and Abstracts Views on Vision4Press platform.
Data correspond to usage on the plateform after 2015. The current usage metrics is available 48-96 hours after online publication and is updated daily on week days.
Initial download of the metrics may take a while.