Fig. 6.
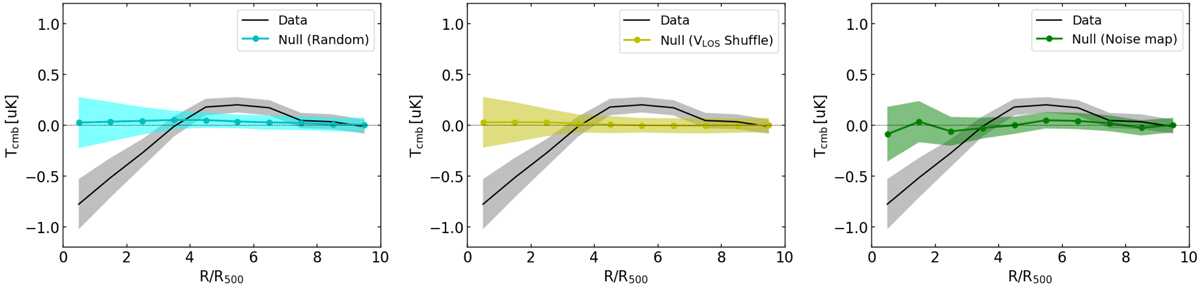
Velocity-weighted kSZ radial profile around the 30 431 WHL clusters with the Planck temperature map at 217 GHz (black) compared to three null tests. Left panel: clusters are displaced at random positions on the Planck map, and then stacked. This process is repeated 1000 times and the mean of the 1000 random samples is computed (cyan). The 1σ uncertainty is estimated by computing a standard deviation of the 1000 random samples. Middle panel: results from cluster stacking after randomly shuffling the LOS velocities of the clusters; this process is repeated 1000 times and the mean of the 100 velocity-shuffled profiles is computed (yellow). The 1σ uncertainty is estimated by computing a standard deviation of the 1000 velocity-shuffled profiles. Right panel: clusters are stacked with a noise map produced by ![]() , where
, where ![]() is the half mission 1(2) Planck map at 217 GHz (green). The 1σ uncertainty is estimated by a bootstrap resampling.
is the half mission 1(2) Planck map at 217 GHz (green). The 1σ uncertainty is estimated by a bootstrap resampling.
Current usage metrics show cumulative count of Article Views (full-text article views including HTML views, PDF and ePub downloads, according to the available data) and Abstracts Views on Vision4Press platform.
Data correspond to usage on the plateform after 2015. The current usage metrics is available 48-96 hours after online publication and is updated daily on week days.
Initial download of the metrics may take a while.