Fig. 3.
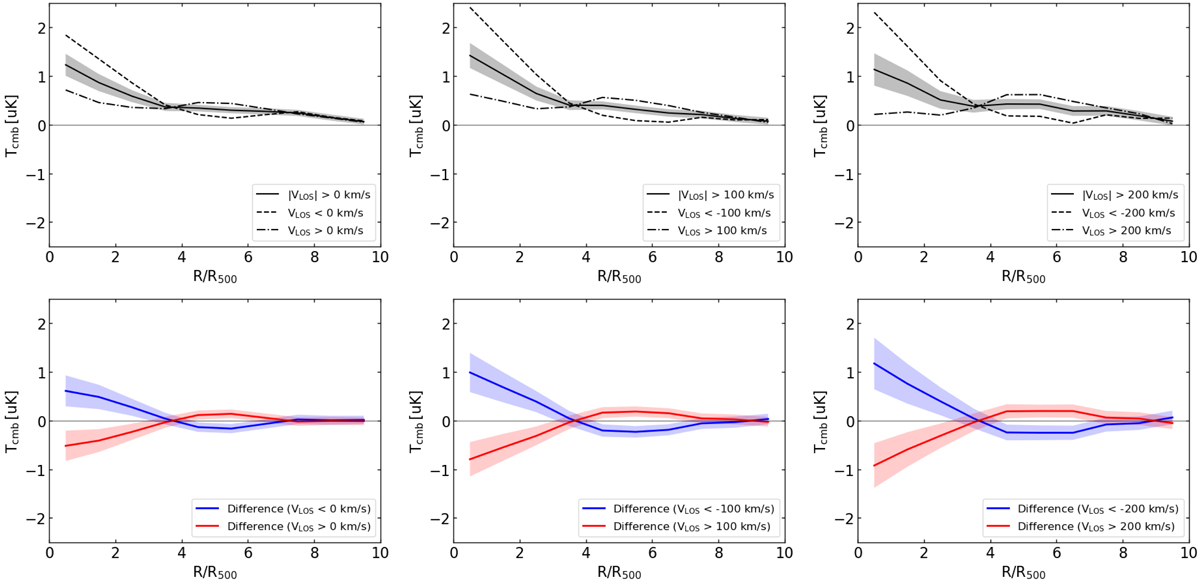
Upper panels, left: stacked radial profile around the 30 431 WHL clusters with the Planck temperature map at 217 GHz (black) with the 1σ uncertainty estimated by a bootstrap resampling (gray). The stacking is performed separately for the 14 093 WHL clusters with negative LOS motions (black dashed line) and for the 16 338 WHL clusters with positive motions (black dash-dotted line). Middle: same as left panel but with an additional LOS velocity cut of 100 km s−1. Right: same as left panel but with an additional LOS velocity cut of 200 km s−1. Lower panels: positive kSZ radial profile (blue) extracted by taking the difference between the black dashed and black lines, and negative kSZ radial profile (red) extracted by taking the difference between the black and black dash-dotted lines.
Current usage metrics show cumulative count of Article Views (full-text article views including HTML views, PDF and ePub downloads, according to the available data) and Abstracts Views on Vision4Press platform.
Data correspond to usage on the plateform after 2015. The current usage metrics is available 48-96 hours after online publication and is updated daily on week days.
Initial download of the metrics may take a while.