Fig. 7.
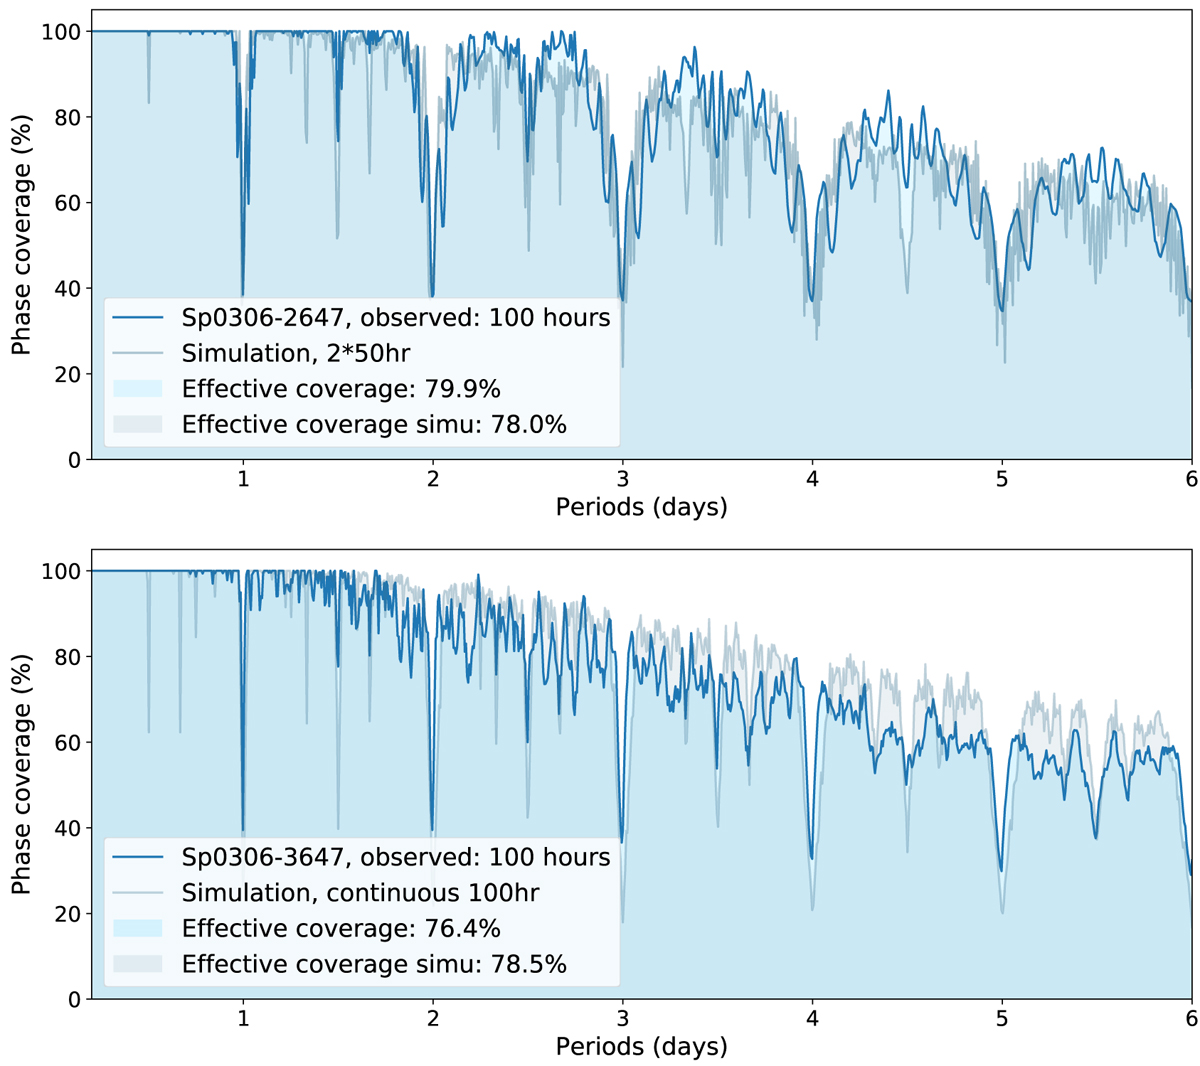
Top: evolution of the phase coverage as a function of the period for one SPECULOOS target (pcrSp0306-2647) observed for 100 h with SSO in two blocks of 50 h several months apart. The solid blue line shows the evolution of the coverage calculated from existing observations whereas the gray line is the result of simulations. Bottom: same for another SPECULOOS target (pcrSp0306-3647) observed 100 h with SSO but on consecutive days.
Current usage metrics show cumulative count of Article Views (full-text article views including HTML views, PDF and ePub downloads, according to the available data) and Abstracts Views on Vision4Press platform.
Data correspond to usage on the plateform after 2015. The current usage metrics is available 48-96 hours after online publication and is updated daily on week days.
Initial download of the metrics may take a while.