Fig. 6.
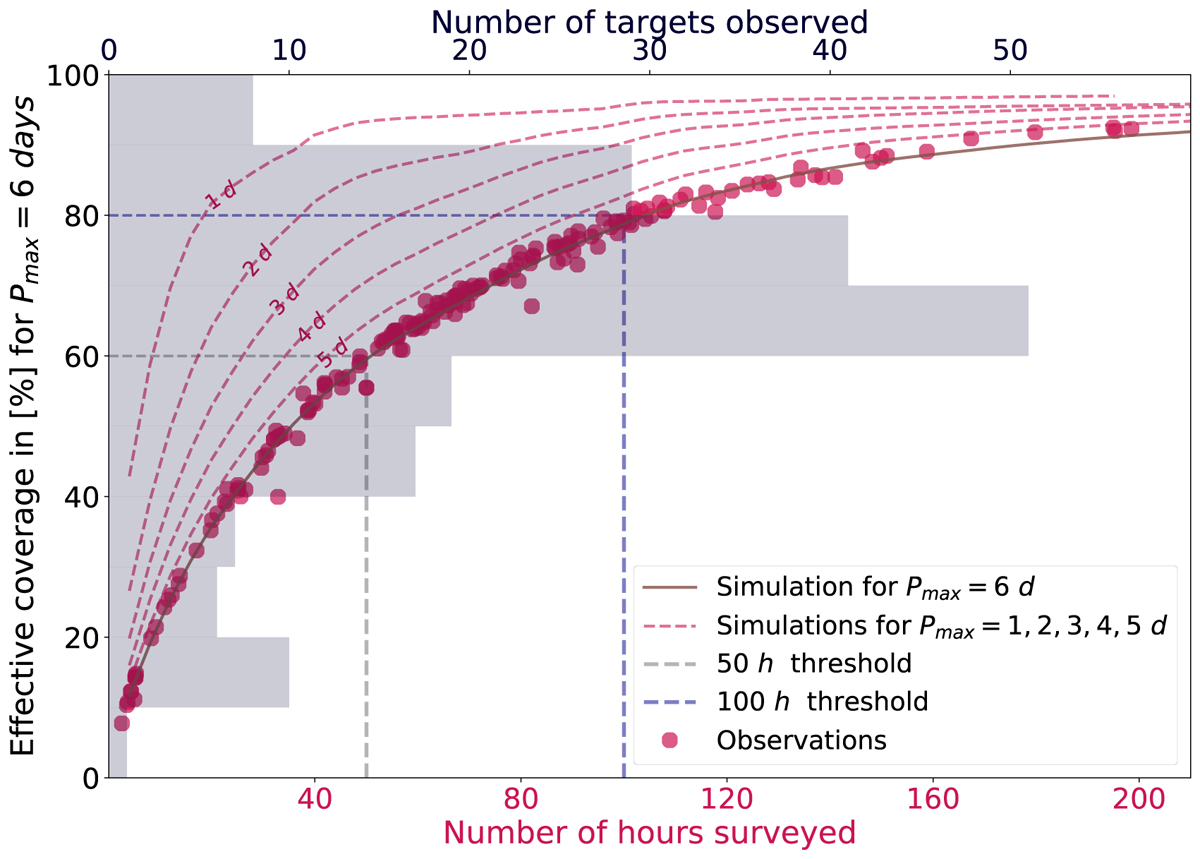
Effective coverage as a function of the number of hours surveyed for all targets observed by the SPECULOOS telescopes so far. Coloured dots shows the coverage calculated from existing observation, for periods going from 0.1 to 6 days. The solid red line is the corresponding simulation. Dashed red lines are simulations for various values of Pmax ranging from one to five days. Gray histogram: number of targets in each slice of coverage.
Current usage metrics show cumulative count of Article Views (full-text article views including HTML views, PDF and ePub downloads, according to the available data) and Abstracts Views on Vision4Press platform.
Data correspond to usage on the plateform after 2015. The current usage metrics is available 48-96 hours after online publication and is updated daily on week days.
Initial download of the metrics may take a while.