Open Access
Fig. 9.
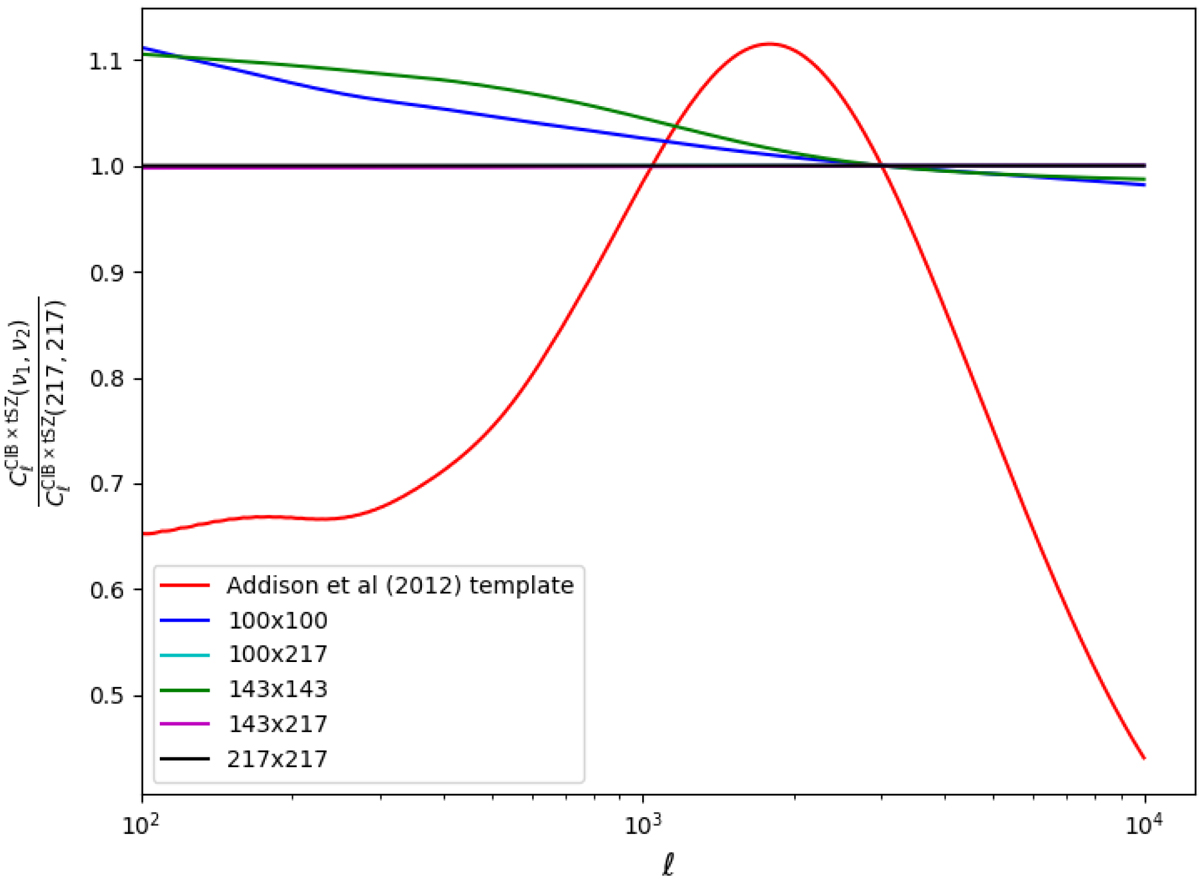
Ratio of the CIB × tSZ power spectra at different frequencies and at 217 × 217 GHz. The red curve shows the ratio with the CIB × tSZ template from Addison et al. (2012) used in the Planck Collaboration V (2020) likelihood analysis. All the power spectra are normalised such that they have the same value at ℓ = 3000.
Current usage metrics show cumulative count of Article Views (full-text article views including HTML views, PDF and ePub downloads, according to the available data) and Abstracts Views on Vision4Press platform.
Data correspond to usage on the plateform after 2015. The current usage metrics is available 48-96 hours after online publication and is updated daily on week days.
Initial download of the metrics may take a while.