Free Access
Fig. 6.
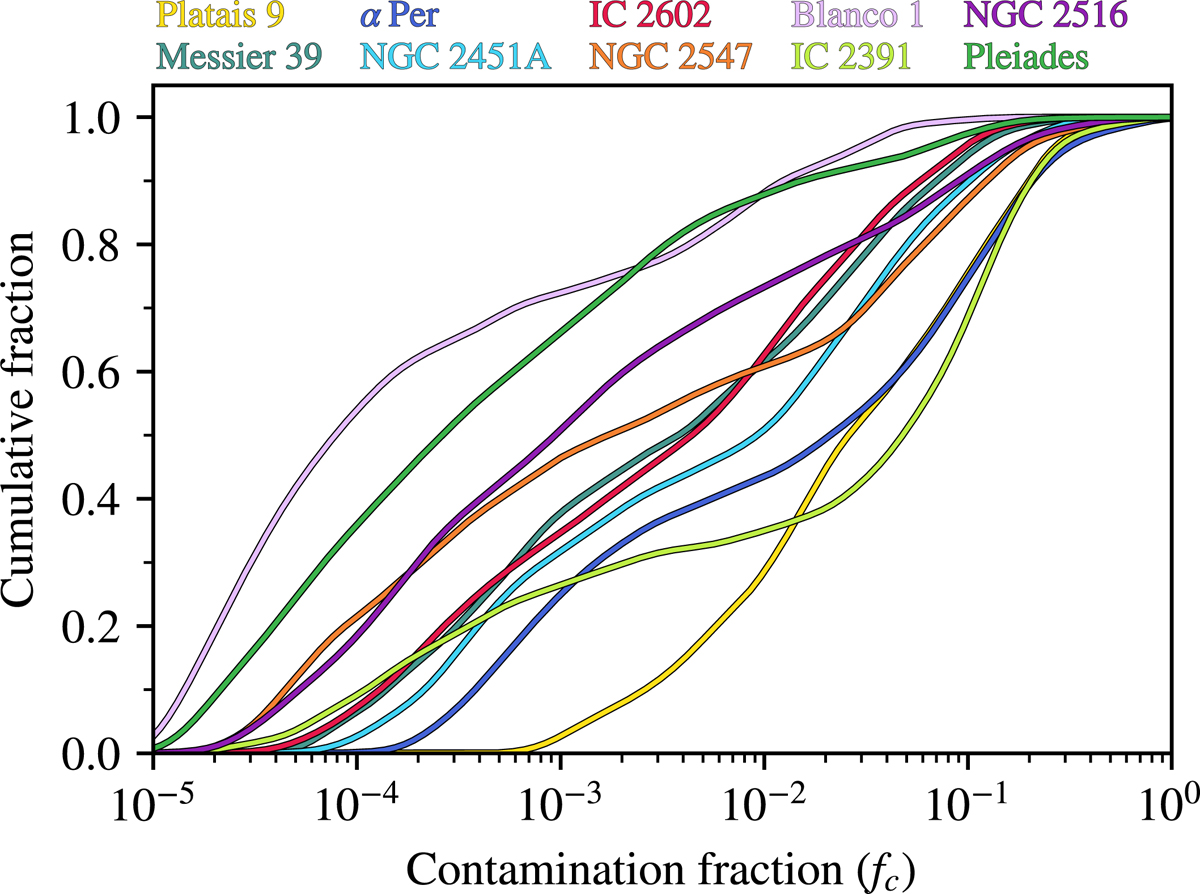
Cumulative distributions of the source contamination fractions fc for each cluster. The contamination fraction fc denotes the volume density contrast for each source with respect to the surrounding background population.
Current usage metrics show cumulative count of Article Views (full-text article views including HTML views, PDF and ePub downloads, according to the available data) and Abstracts Views on Vision4Press platform.
Data correspond to usage on the plateform after 2015. The current usage metrics is available 48-96 hours after online publication and is updated daily on week days.
Initial download of the metrics may take a while.