Fig. 3.
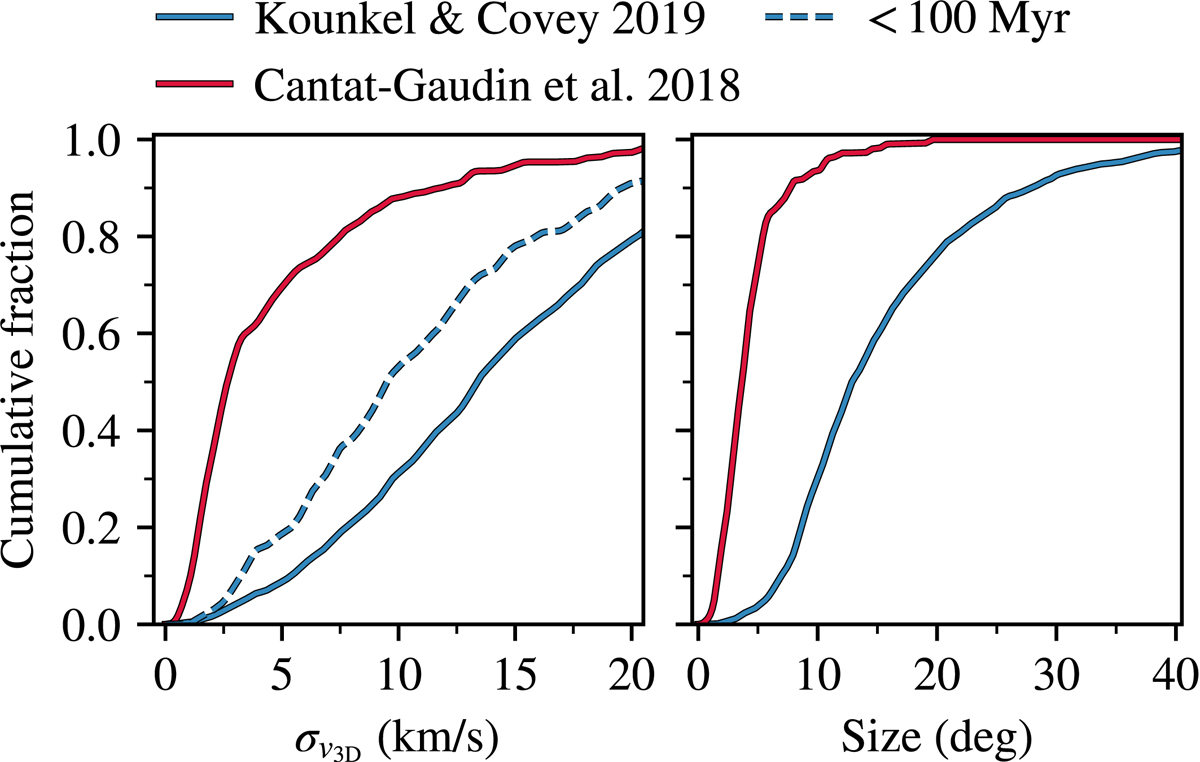
Cumulative histograms for the deconvolved 3D velocity dispersions (left panel) and apparent sizes (right panel) of identified structures as published by Cantat-Gaudin et al. (2018; red) and Kounkel & Covey (2019; blue). Cantat-Gaudin et al. characterized members close to known clusters with relatively small velocity dispersions. Kounkel & Covey identified much larger structures, but more than 90% of the populations feature velocity dispersions greater than 5 km s−1. Young structures (< 100 Myr) in the sample from Kounkel & Covey (2019; dashed blue line) also feature mostly relatively large velocity dispersions.
Current usage metrics show cumulative count of Article Views (full-text article views including HTML views, PDF and ePub downloads, according to the available data) and Abstracts Views on Vision4Press platform.
Data correspond to usage on the plateform after 2015. The current usage metrics is available 48-96 hours after online publication and is updated daily on week days.
Initial download of the metrics may take a while.