Fig. A.5.
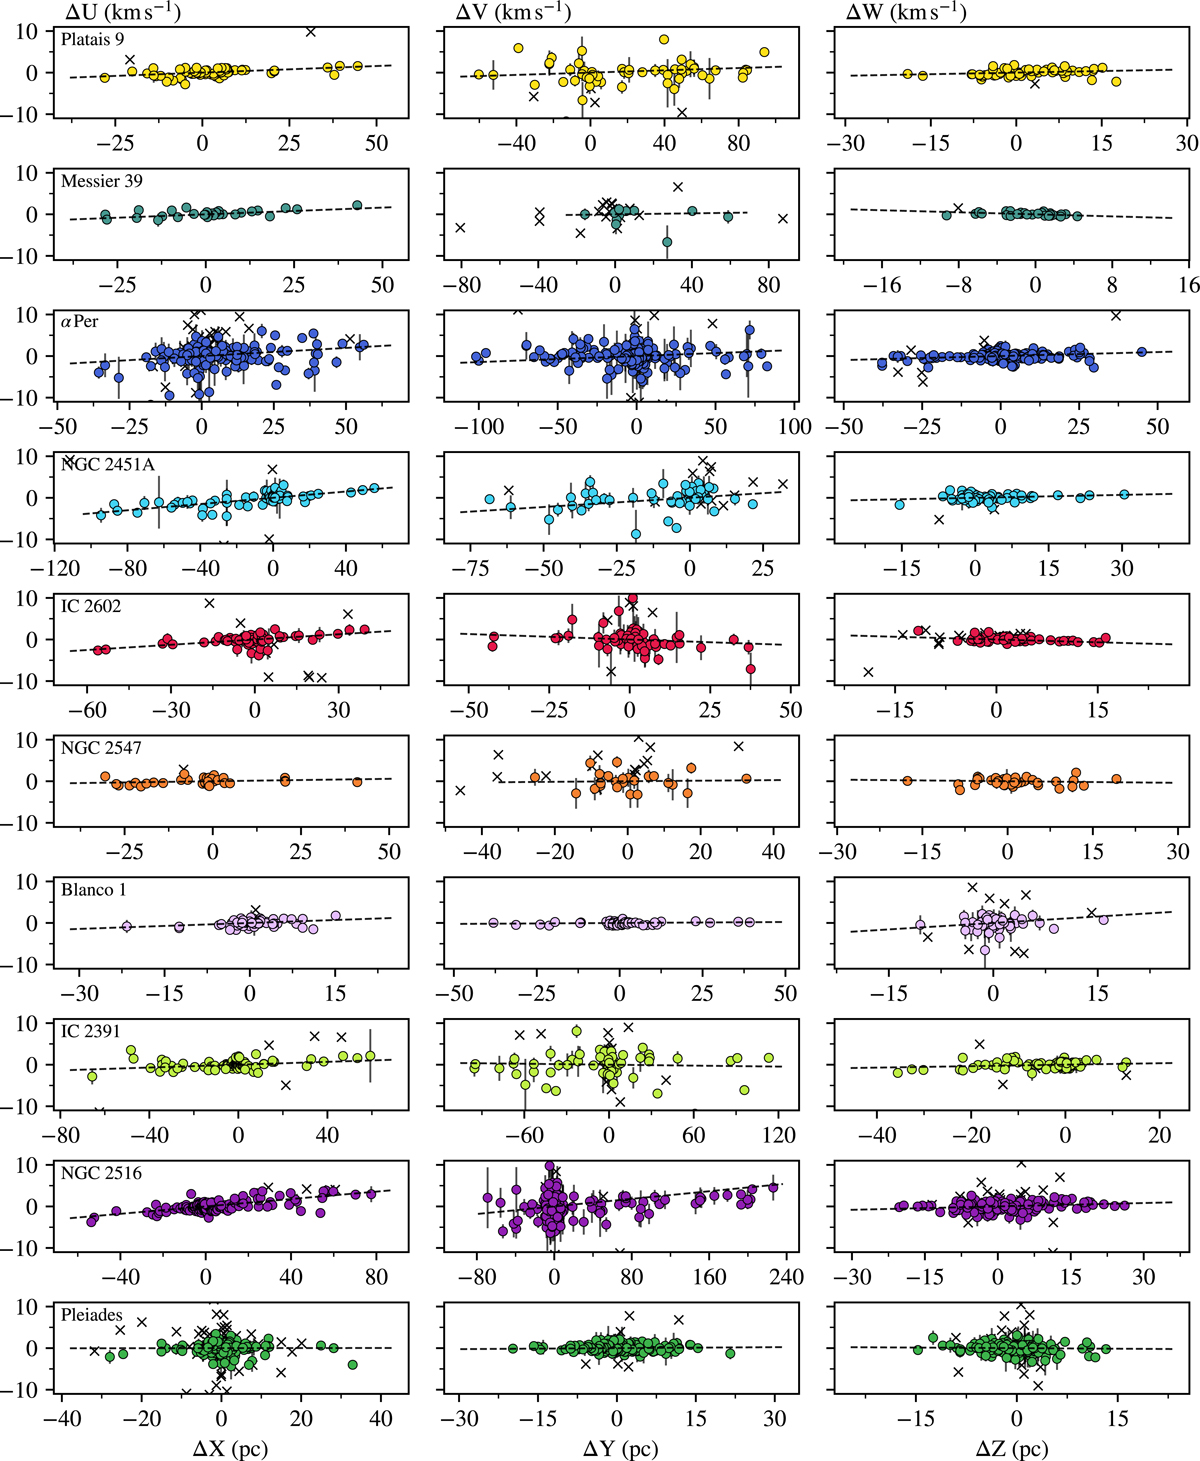
Linear expansion model fits. Each row represents an individual cluster. The columns from left to right show the relation and linear fits for the parameter combinations X–U, Y–V, and Z–W, respectively. All values are shown relative to the density maxima or bulk motions of the clusters. The crosses are individual measurements below 3σ significance and were not included in the fit.
Current usage metrics show cumulative count of Article Views (full-text article views including HTML views, PDF and ePub downloads, according to the available data) and Abstracts Views on Vision4Press platform.
Data correspond to usage on the plateform after 2015. The current usage metrics is available 48-96 hours after online publication and is updated daily on week days.
Initial download of the metrics may take a while.