Fig. A.4.
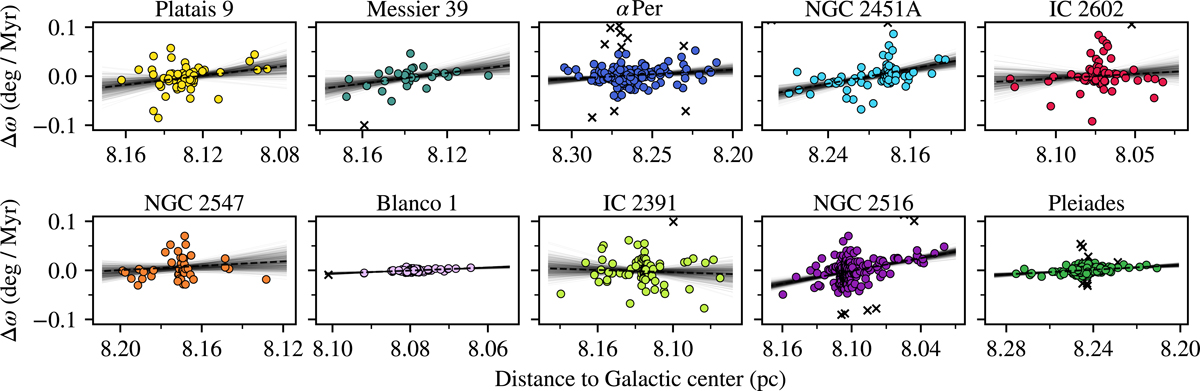
Galactocentric angular velocity ω as a function of galactocentric radius for each cluster. The solid gray lines show 500 independent bootstrapped fitting results. The dashed lines are the adopted linear fits that were determined as the median of all realizations. The crosses are individual measurements below 3σ significance and were not included in the fit.
Current usage metrics show cumulative count of Article Views (full-text article views including HTML views, PDF and ePub downloads, according to the available data) and Abstracts Views on Vision4Press platform.
Data correspond to usage on the plateform after 2015. The current usage metrics is available 48-96 hours after online publication and is updated daily on week days.
Initial download of the metrics may take a while.