Fig. A.3.
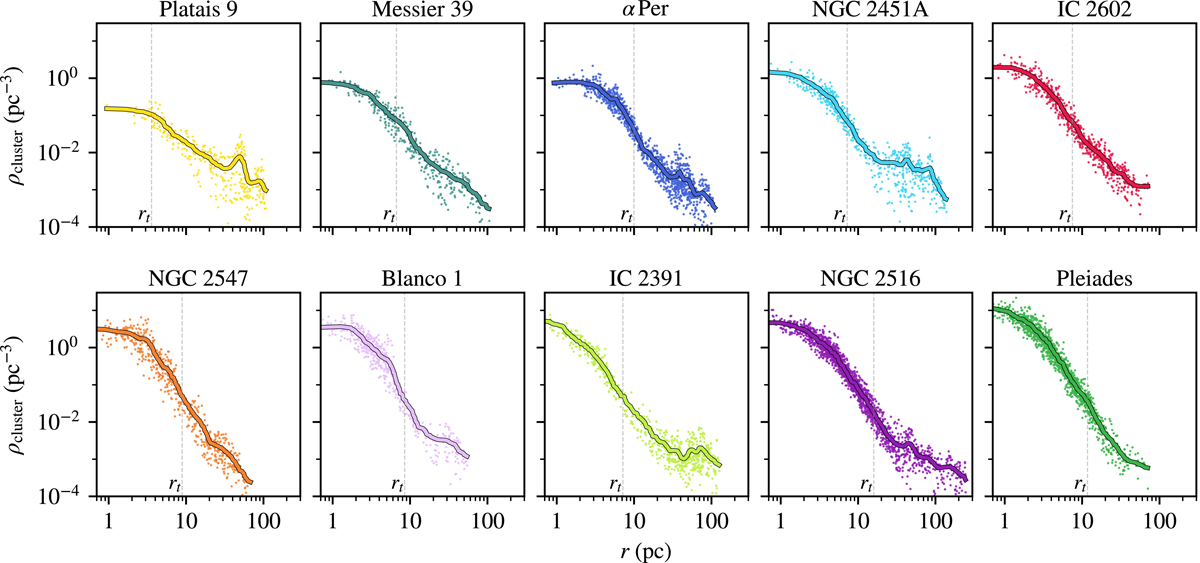
Volume number density profiles as a function of radius from the density maxima of the clusters. The volume density was parameterized with the seventh nearest neighbor of each source. The solid colored lines represent a smoothed running median that is plotted in addition to the values for individual sources. For reference, the tidal radius of each cluster is marked with a vertical gray dashed line.
Current usage metrics show cumulative count of Article Views (full-text article views including HTML views, PDF and ePub downloads, according to the available data) and Abstracts Views on Vision4Press platform.
Data correspond to usage on the plateform after 2015. The current usage metrics is available 48-96 hours after online publication and is updated daily on week days.
Initial download of the metrics may take a while.