Free Access
Fig. A.2.
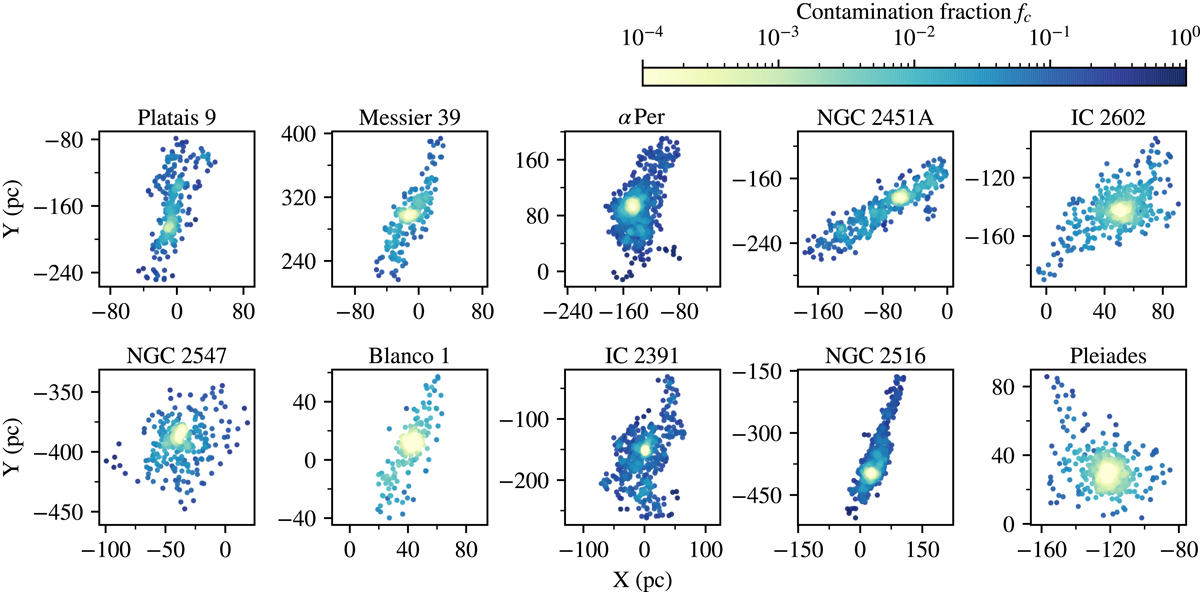
Source distribution in the XY plane (centered on the Sun) for each cluster, color-coded with the contamination fraction fc. We observe a strong correlation between fc and the distance from the cluster centers, resulting from much lower volume number densities in the coronae.
Current usage metrics show cumulative count of Article Views (full-text article views including HTML views, PDF and ePub downloads, according to the available data) and Abstracts Views on Vision4Press platform.
Data correspond to usage on the plateform after 2015. The current usage metrics is available 48-96 hours after online publication and is updated daily on week days.
Initial download of the metrics may take a while.