Fig. 10.
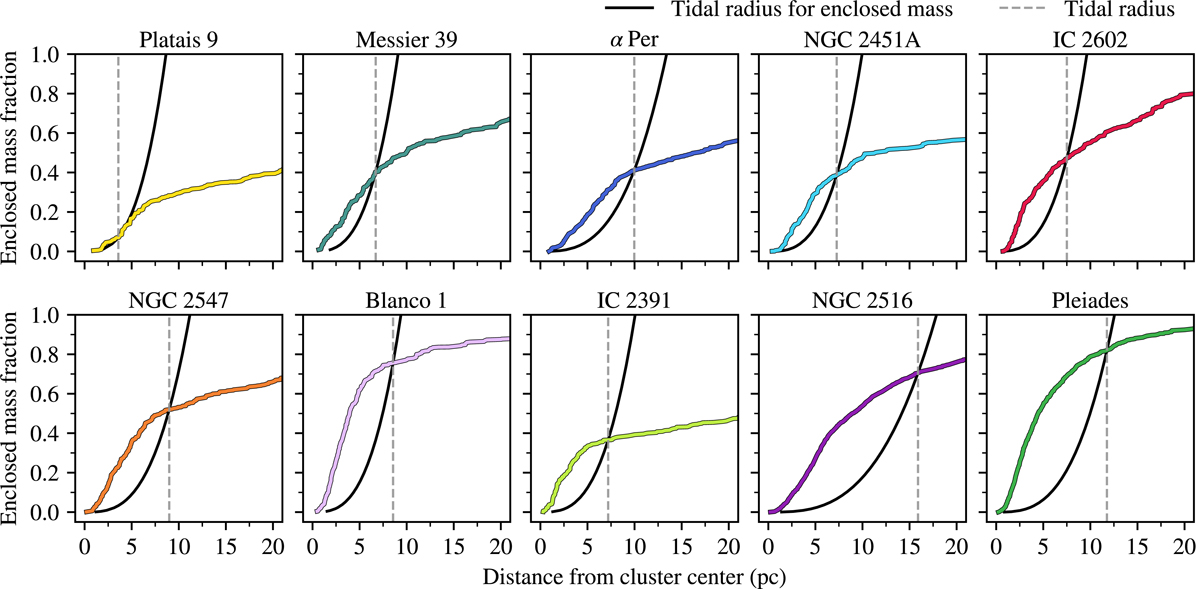
Radial mass profiles and tidal radii for each cluster population. The colored lines depict the enclosed mass fraction as a function of distance from the density maximum of each population. The solid black lines trace the tidal radius for a given enclosed total mass content. The intersection of these profiles identifies the tidal radius. The mass profiles themselves depict a variety of shapes, with some clusters showing clear kinks near the tidal radius. For the majority of the clusters, the mass profiles also reveal that the bulk of their stellar mass content is located beyond the tidal radii in the stellar coronae.
Current usage metrics show cumulative count of Article Views (full-text article views including HTML views, PDF and ePub downloads, according to the available data) and Abstracts Views on Vision4Press platform.
Data correspond to usage on the plateform after 2015. The current usage metrics is available 48-96 hours after online publication and is updated daily on week days.
Initial download of the metrics may take a while.