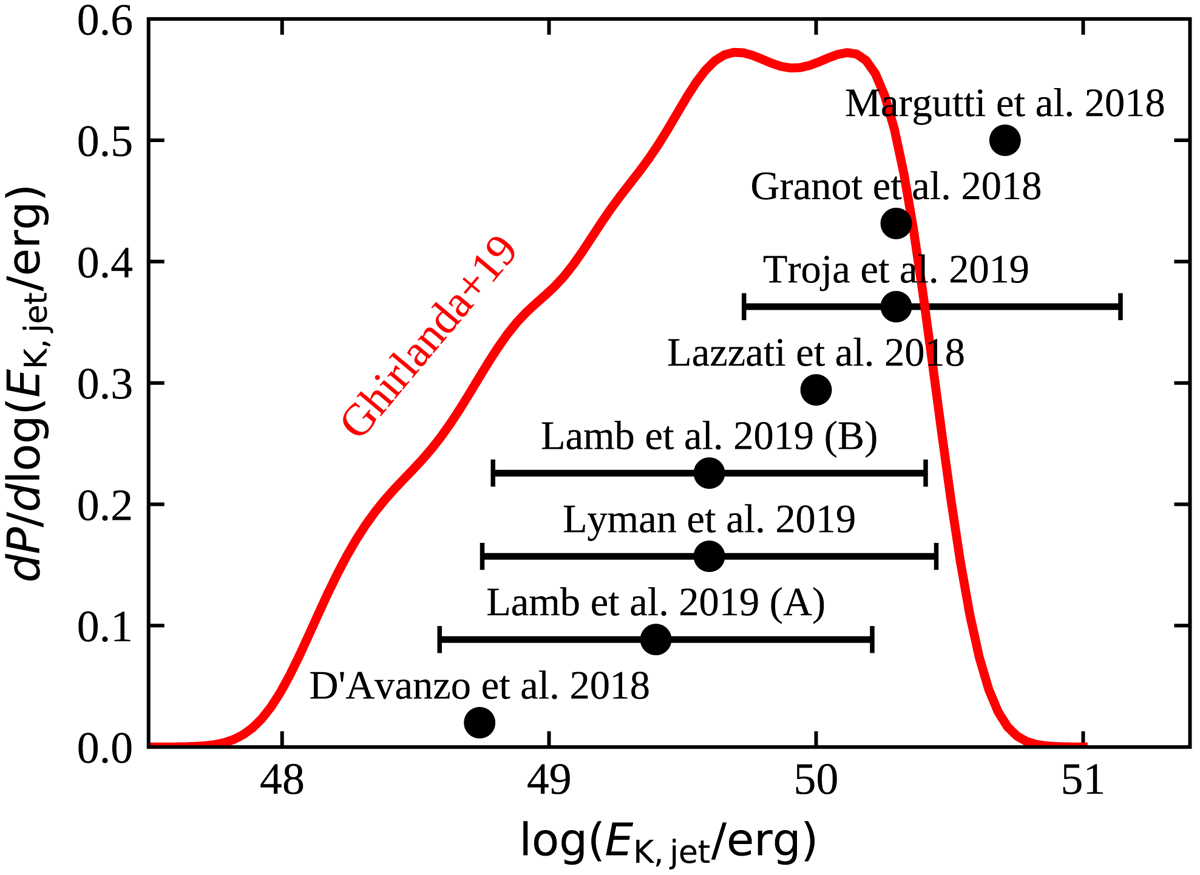
Fig. 2.

Kinetic energy in the GRB 1790817A jet during the afterglow phase. The solid red line shows the posterior distribution constructed by fitting a structured jet afterglow model to the multi-wavelength afterglow and VLBI centroid motion by Ghirlanda et al. (2019). Black dots with error bars represent the estimates presented in several other papers, all based on afterglow fitting. All estimates essentially agree within the uncertainties.
Current usage metrics show cumulative count of Article Views (full-text article views including HTML views, PDF and ePub downloads, according to the available data) and Abstracts Views on Vision4Press platform.
Data correspond to usage on the plateform after 2015. The current usage metrics is available 48-96 hours after online publication and is updated daily on week days.
Initial download of the metrics may take a while.


