Fig. 1.
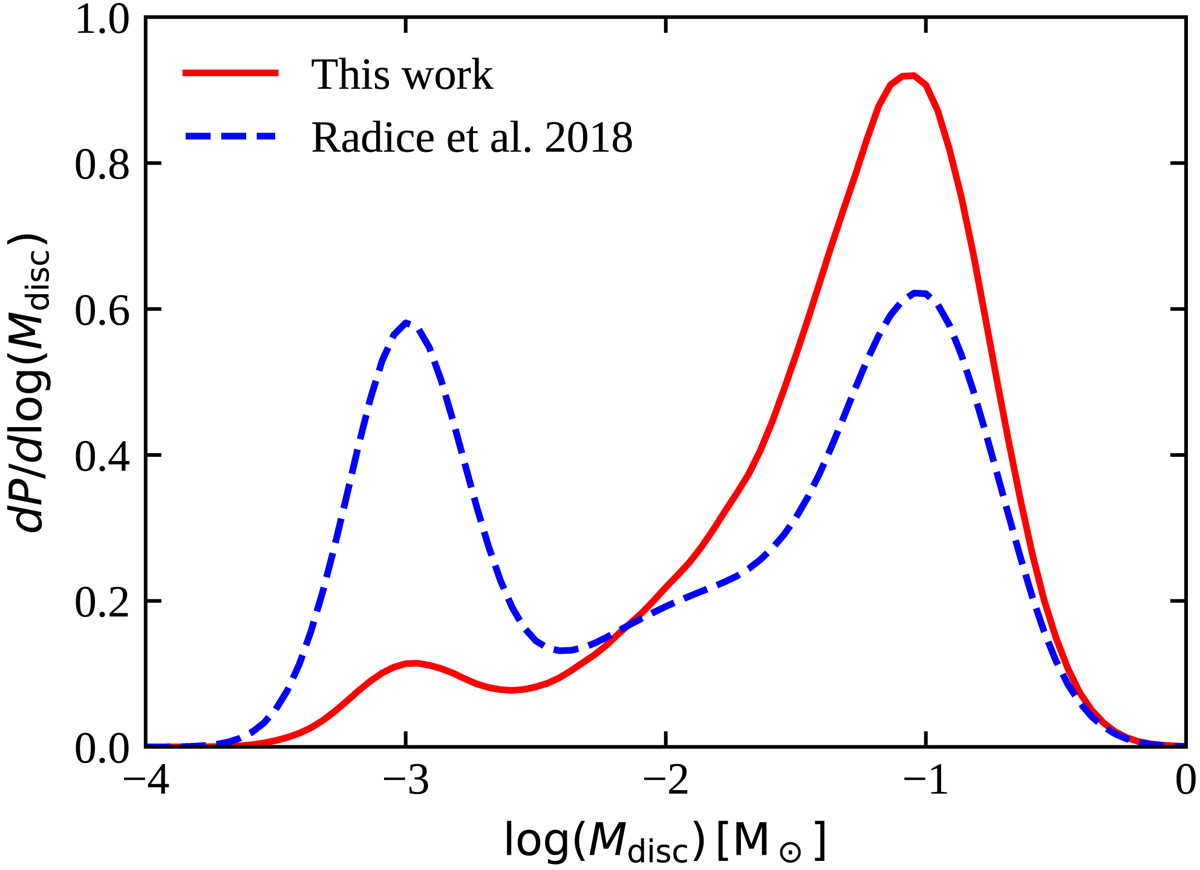
GW170817 accretion disc mass posterior distributions. The solid red line shows the posterior probability distribution of the logarithm of the accretion disc mass (in solar masses) for the low-spin LVC priors. The dashed blue line shows the corresponding result that would have been obtained using the disc mass fitting formula from Radice et al. (2018).
Current usage metrics show cumulative count of Article Views (full-text article views including HTML views, PDF and ePub downloads, according to the available data) and Abstracts Views on Vision4Press platform.
Data correspond to usage on the plateform after 2015. The current usage metrics is available 48-96 hours after online publication and is updated daily on week days.
Initial download of the metrics may take a while.