Fig. 2.
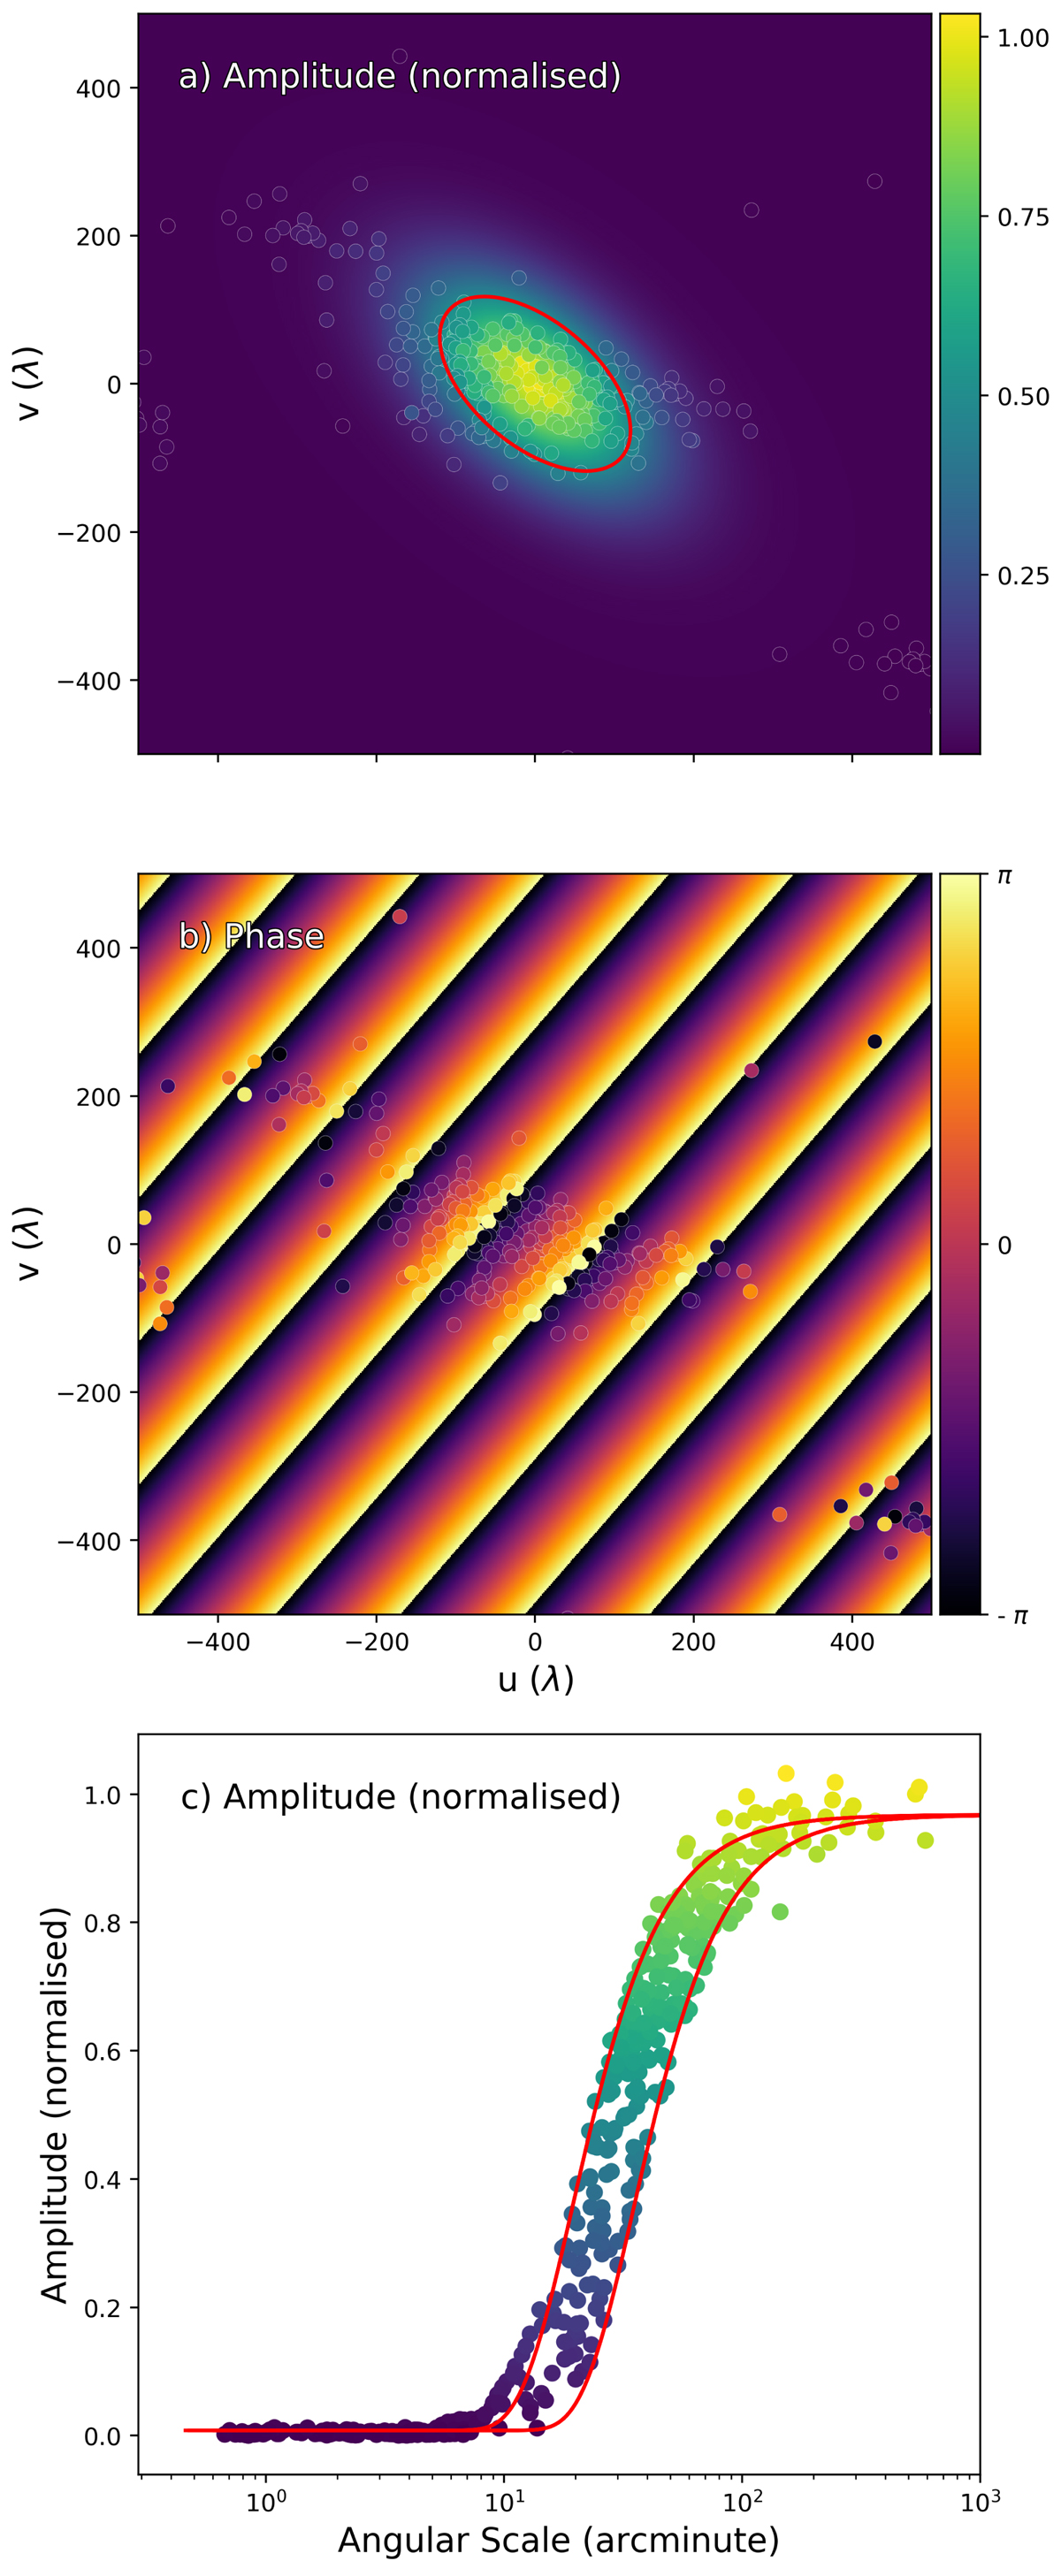
Results of directly fitting the LOFAR visibilities. a: amplitudes of visibilities in the uv plane for the LOFAR observation. The background colour map shows a Gaussian fit. The red ellipse shows the FWHM of the normalised amplitude. b: visibility phase in the uv plane. The background colour map shows the fitted phase angle. c: visibility amplitudes received from different angular scales. The red curves indicate the FWHM of the semi-major and semi-minor axes of the fitted Gaussian.
Current usage metrics show cumulative count of Article Views (full-text article views including HTML views, PDF and ePub downloads, according to the available data) and Abstracts Views on Vision4Press platform.
Data correspond to usage on the plateform after 2015. The current usage metrics is available 48-96 hours after online publication and is updated daily on week days.
Initial download of the metrics may take a while.