Fig. 1.
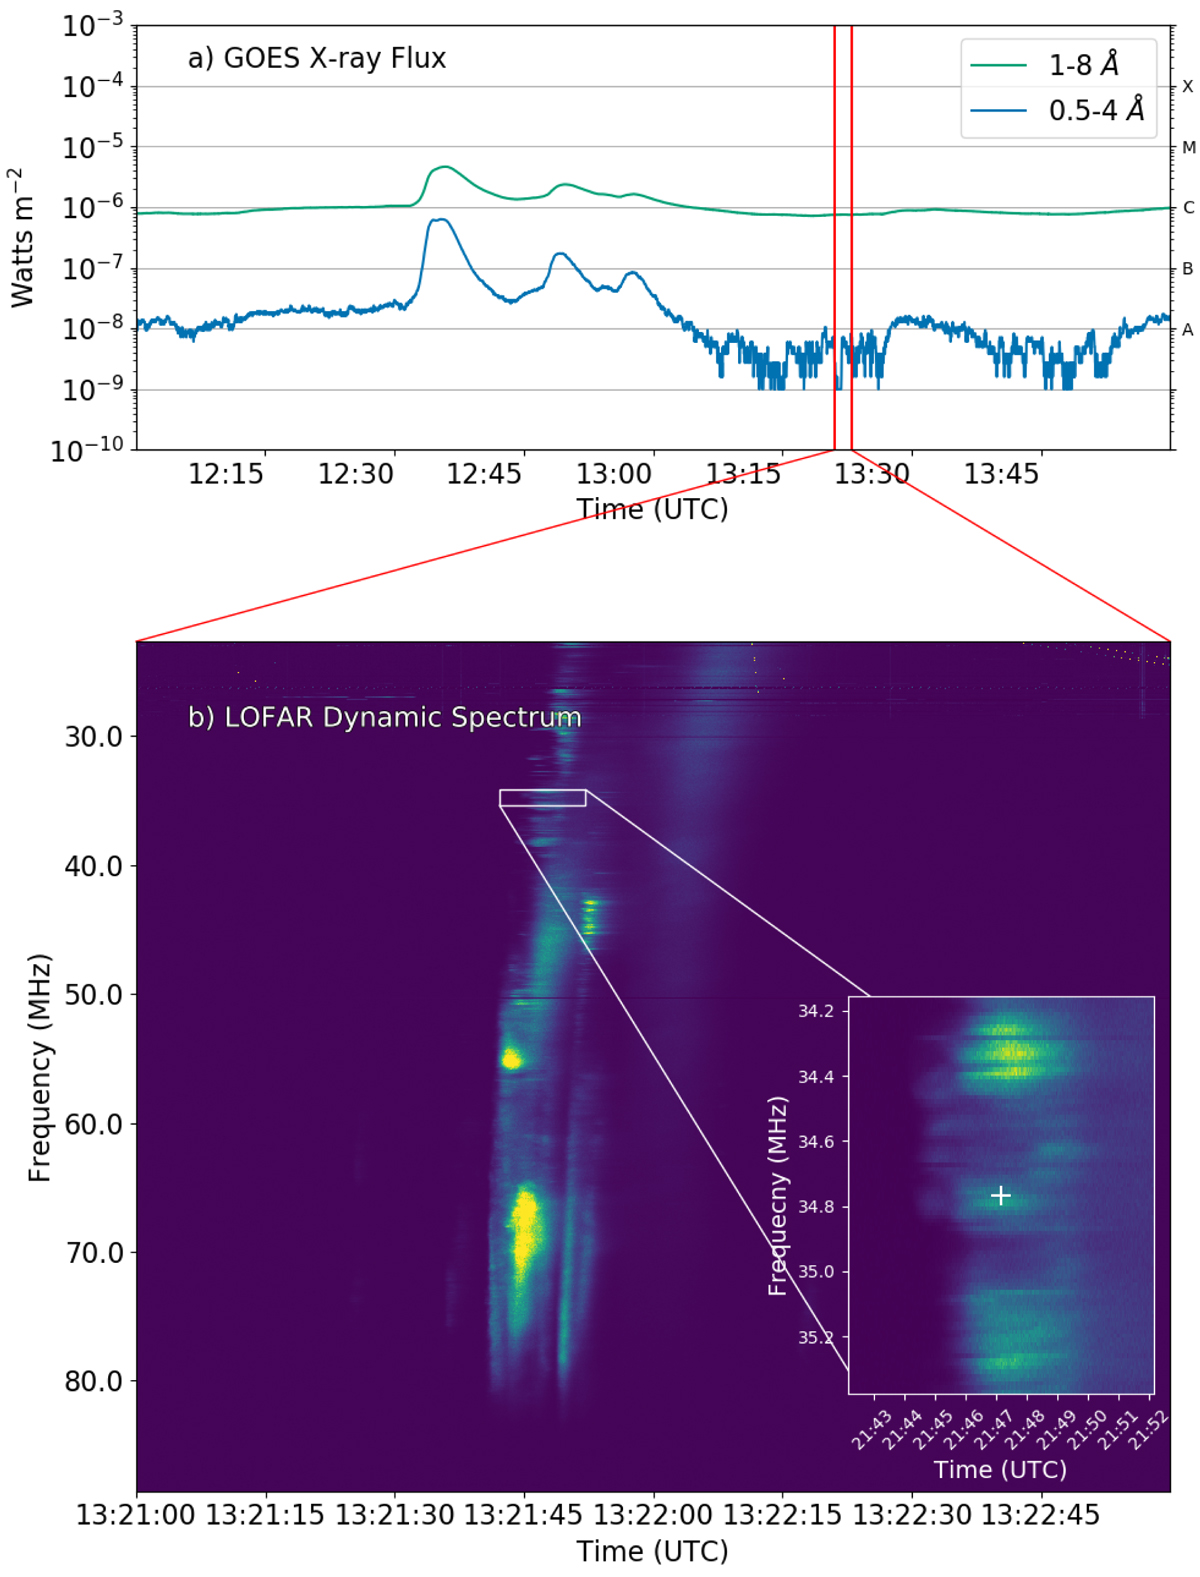
Overview of the X-ray flux and LOFAR dynamic spectrum for the observation on 17 October 2015. a: GOES X-ray lightcurves for the duration of the LOFAR solar observation. Minimal activity other than a number of C-class flares prior to 13:00 UTC is observed. Red vertical lines indicate the time range of the radio analysis. b: dynamic spectrum of a Type III solar radio burst observed with LOFAR station RS509. We note the striations in frequency that are particularly apparent below 40 MHz. The inset is a zoom-in of the region in the white box, which shows striation in the burst. The white cross indicates the time and frequency at which the images described in Sect. 3 are made.
Current usage metrics show cumulative count of Article Views (full-text article views including HTML views, PDF and ePub downloads, according to the available data) and Abstracts Views on Vision4Press platform.
Data correspond to usage on the plateform after 2015. The current usage metrics is available 48-96 hours after online publication and is updated daily on week days.
Initial download of the metrics may take a while.