Fig. 2.
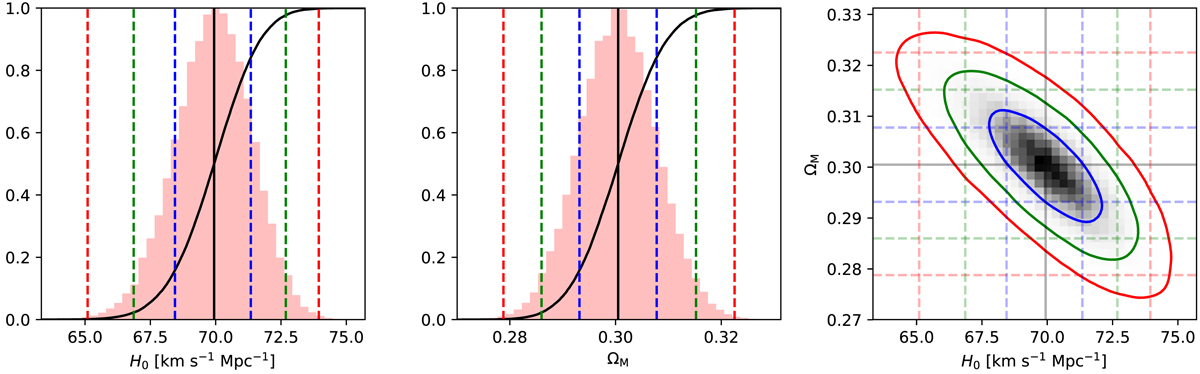
Posterior distribution of H0 and ΩM using all lenses simultaneously. Two left panels show the marginalised distributions. Vertical dashed lines are the 1, 2, 3σ limits (68.3%, 95.4%, 99.7%, respectively, in blue, green, red) and the median (black solid). The total plot range is adapted to the 3σ range. The right panel shows the two-dimensional distribution. The marginalised limits are included as shaded horizontal and vertical lines. The contours show the 2-dimensional 1, 2, 3σ limits, respectively, in blue, green, red. The total range is the same as in the left panels.
Current usage metrics show cumulative count of Article Views (full-text article views including HTML views, PDF and ePub downloads, according to the available data) and Abstracts Views on Vision4Press platform.
Data correspond to usage on the plateform after 2015. The current usage metrics is available 48-96 hours after online publication and is updated daily on week days.
Initial download of the metrics may take a while.