Open Access
Fig. 1.
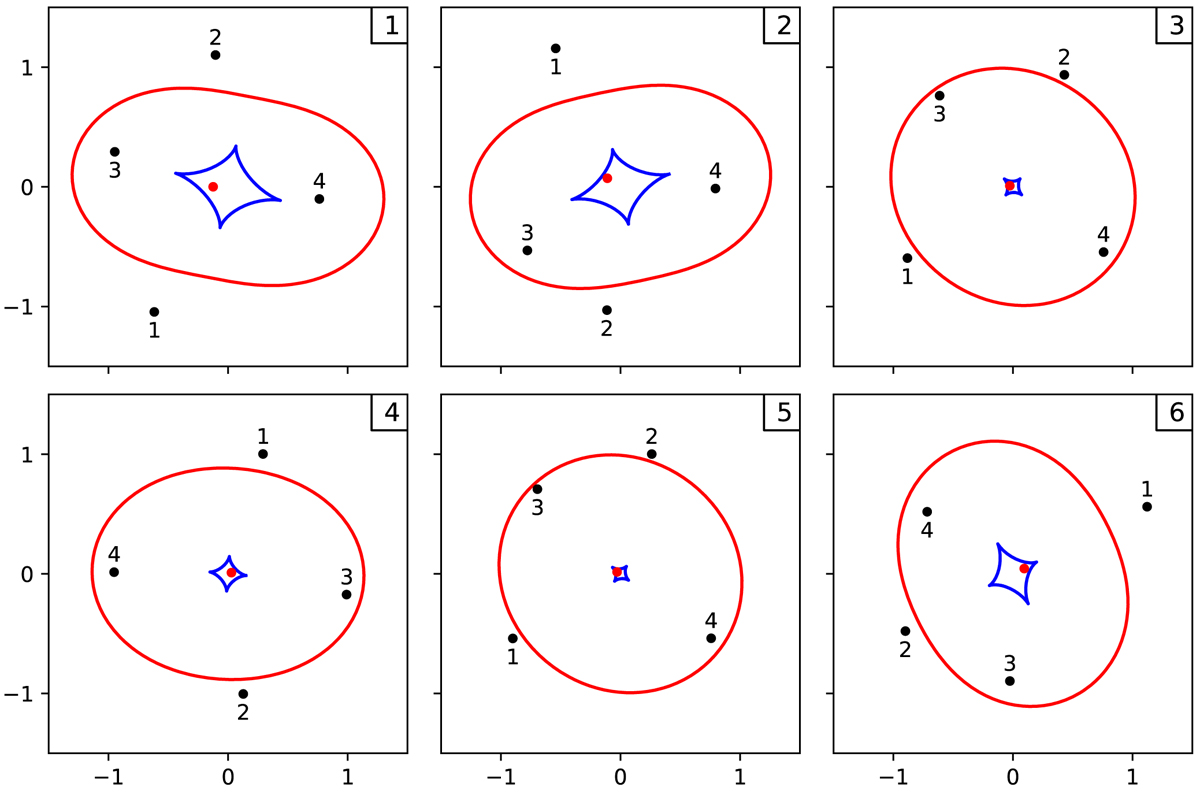
Geometry of the six lenses in our mock sample. The outer red curves are the critical curves and the inner blue diamond-shaped curves are the caustics. Images are shown as black dots labelled by increasing time delay and the true source positions are the red dots near the centres. The scale is given in arcseconds.
Current usage metrics show cumulative count of Article Views (full-text article views including HTML views, PDF and ePub downloads, according to the available data) and Abstracts Views on Vision4Press platform.
Data correspond to usage on the plateform after 2015. The current usage metrics is available 48-96 hours after online publication and is updated daily on week days.
Initial download of the metrics may take a while.