Free Access
Fig. 2.
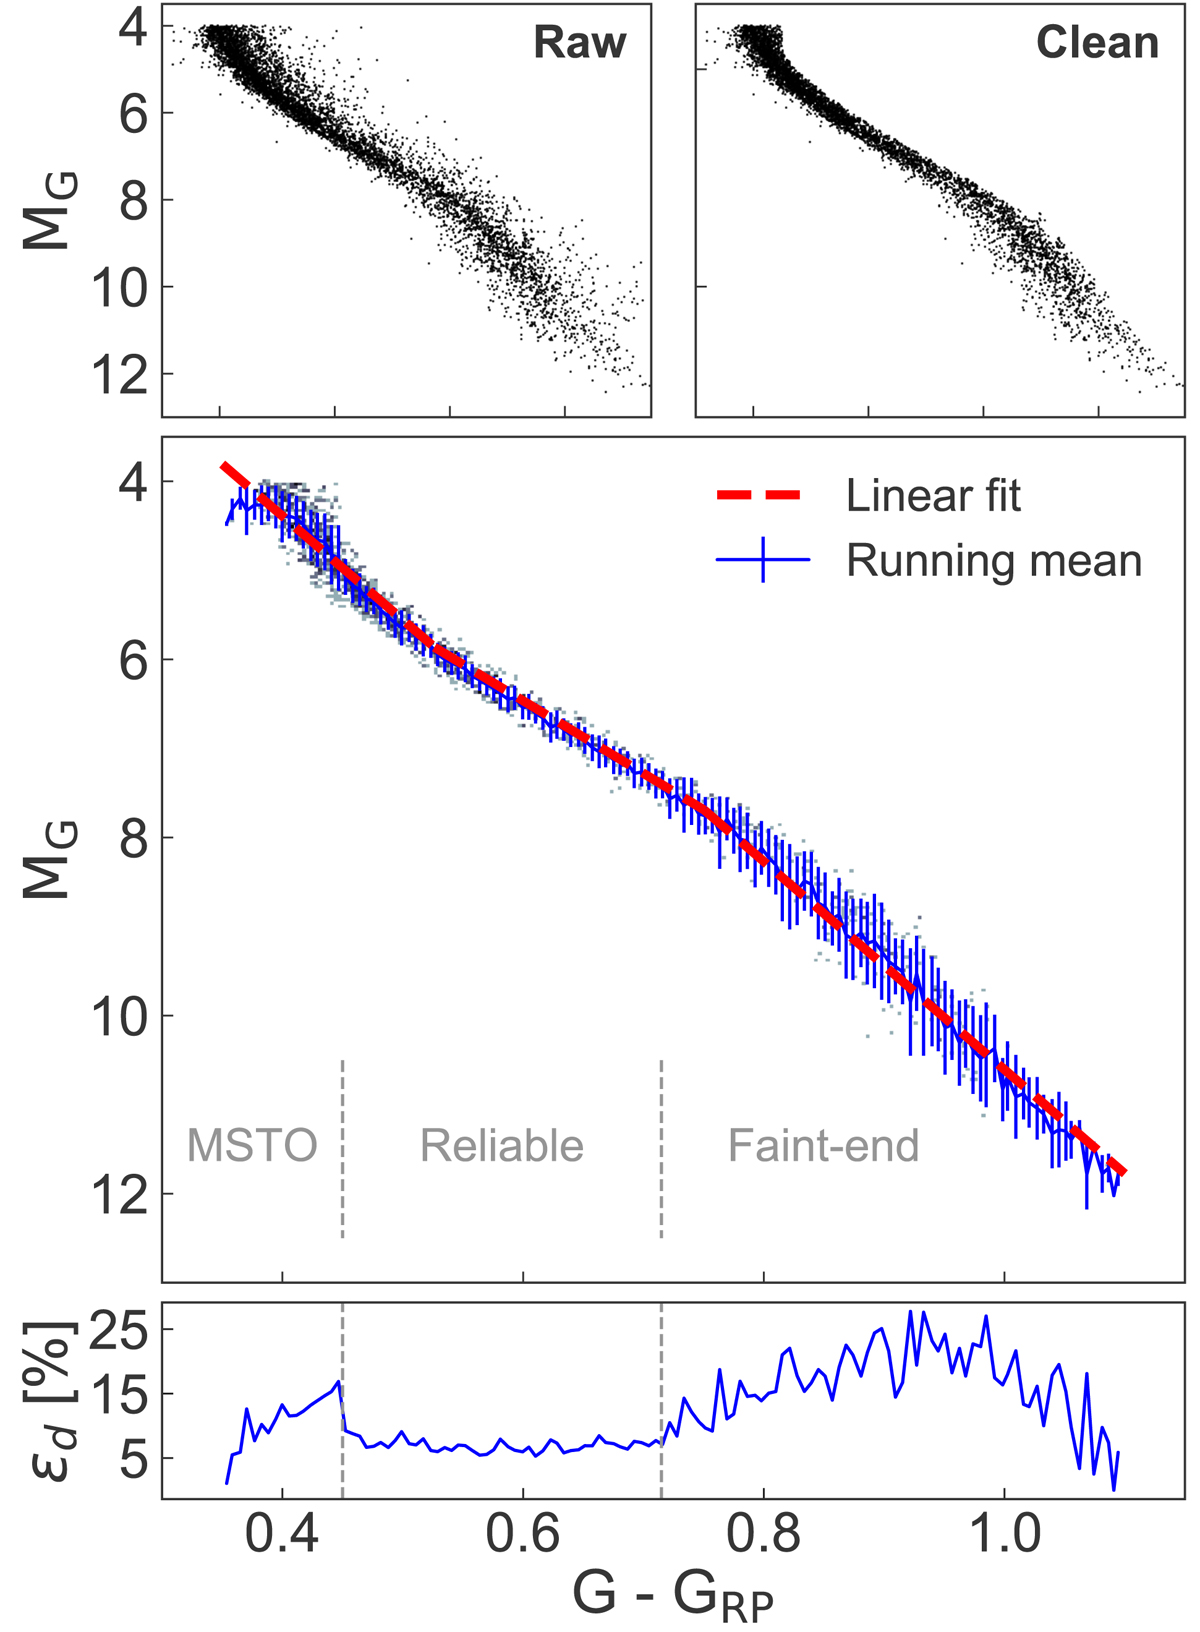
Top panels: raw data (left) and the cleaned data (right) that are used for the fit. Middle: two fits of the main sequence (MS). Bottom: error in distance is related to the measured thickness of the MS. The dashed lines indicate the range where the MS is reliable enough to calibrate photometric distances.
Current usage metrics show cumulative count of Article Views (full-text article views including HTML views, PDF and ePub downloads, according to the available data) and Abstracts Views on Vision4Press platform.
Data correspond to usage on the plateform after 2015. The current usage metrics is available 48-96 hours after online publication and is updated daily on week days.
Initial download of the metrics may take a while.