Fig. 16.
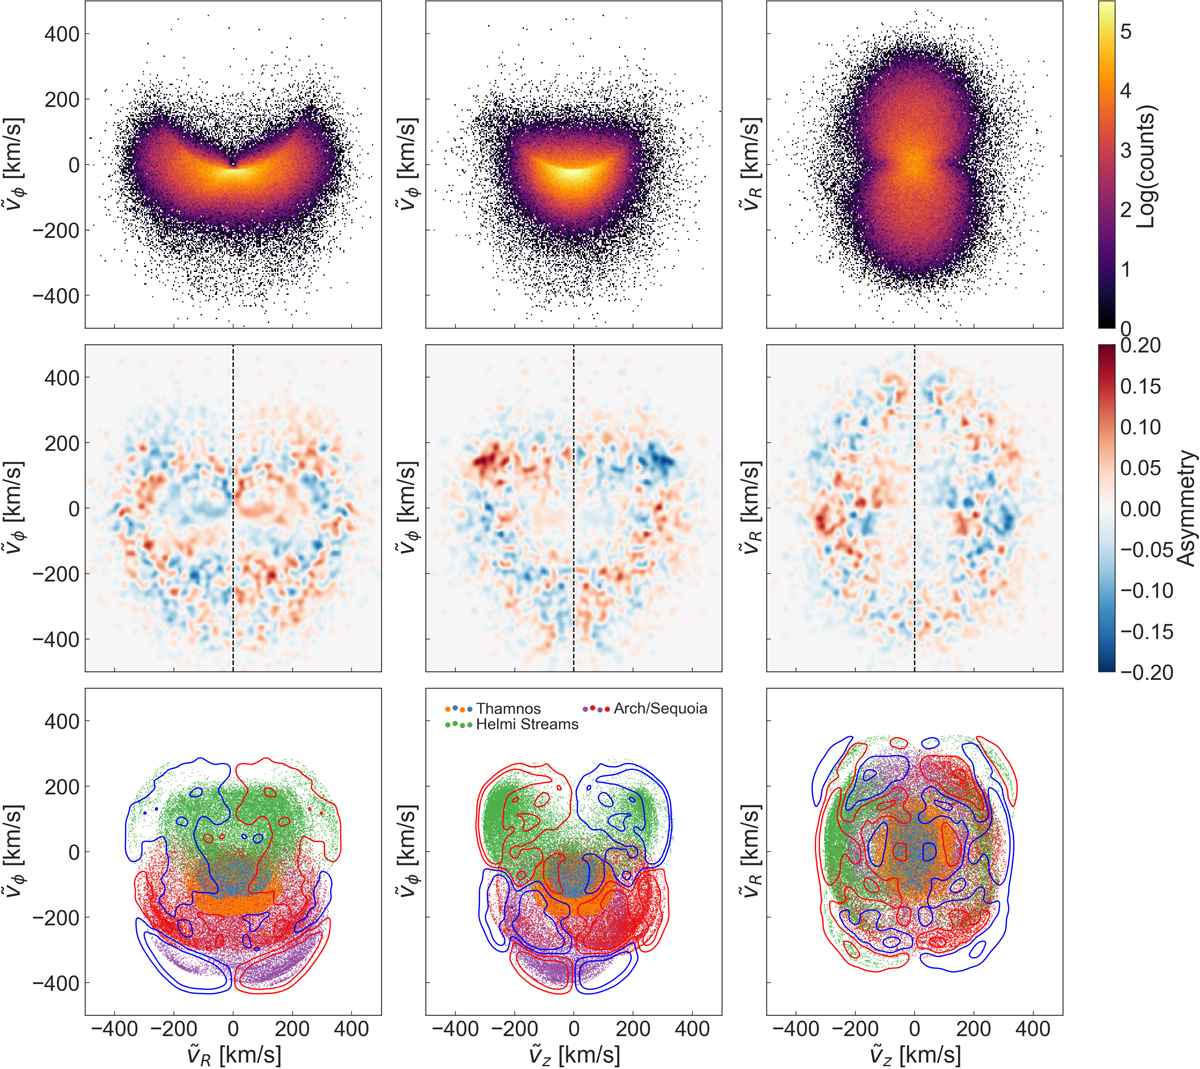
Velocity distributions of local (d < 2 kpc) halo stars calculated without the line-of-sight component. For each combination of the cylindrical velocity components a 2D-histogram is shown in the top row, while the asymmetry (defined as in Eq. (21)) with respect to the velocity plotted on the x-axis is shown in the middle row. We compare the maps to the asymmetry originating from a few structures that have been identified in the 6D sample in the bottom row. The asymmetry fleshes out structures that are asymmetric in either ṽR or ṽϕ. Structures that are clearly present in the RPM sample, see middle row, are the Helmi Streams (green dots) and Sequoia (red and purple dots).
Current usage metrics show cumulative count of Article Views (full-text article views including HTML views, PDF and ePub downloads, according to the available data) and Abstracts Views on Vision4Press platform.
Data correspond to usage on the plateform after 2015. The current usage metrics is available 48-96 hours after online publication and is updated daily on week days.
Initial download of the metrics may take a while.