Fig. 11.
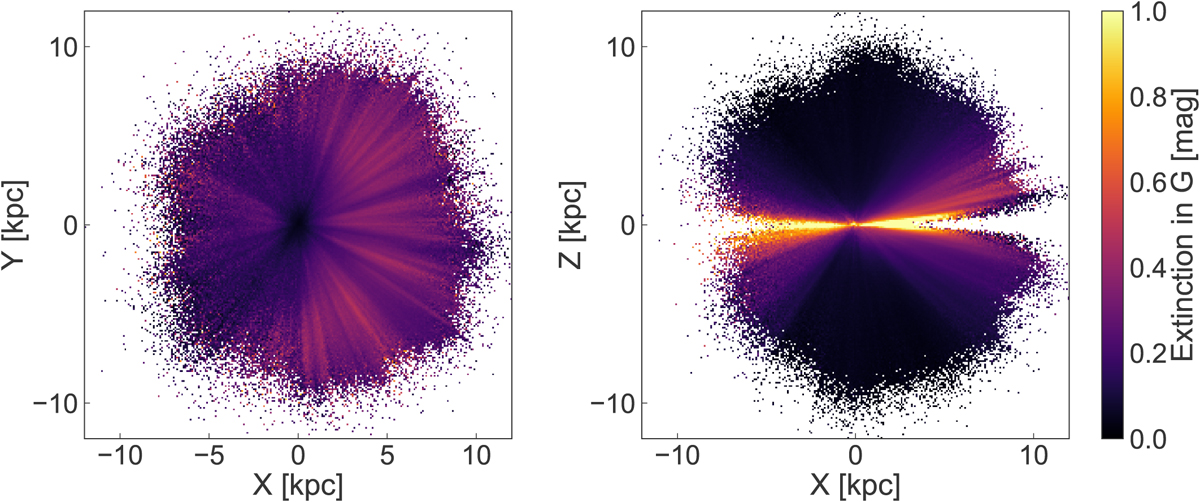
Spatial distribution of the RPM sample projected onto the XY-plane (left) and XZ-plane (right). The sample is binned in 256 × 256 bins, each bin is colour-coded by the mean extinction in G-mag. As expected, low-latitude regions are the most affected. The extinction creates interesting features as a function of galactic ℓ (i.e., the fingers of God features).
Current usage metrics show cumulative count of Article Views (full-text article views including HTML views, PDF and ePub downloads, according to the available data) and Abstracts Views on Vision4Press platform.
Data correspond to usage on the plateform after 2015. The current usage metrics is available 48-96 hours after online publication and is updated daily on week days.
Initial download of the metrics may take a while.