Fig. 10.
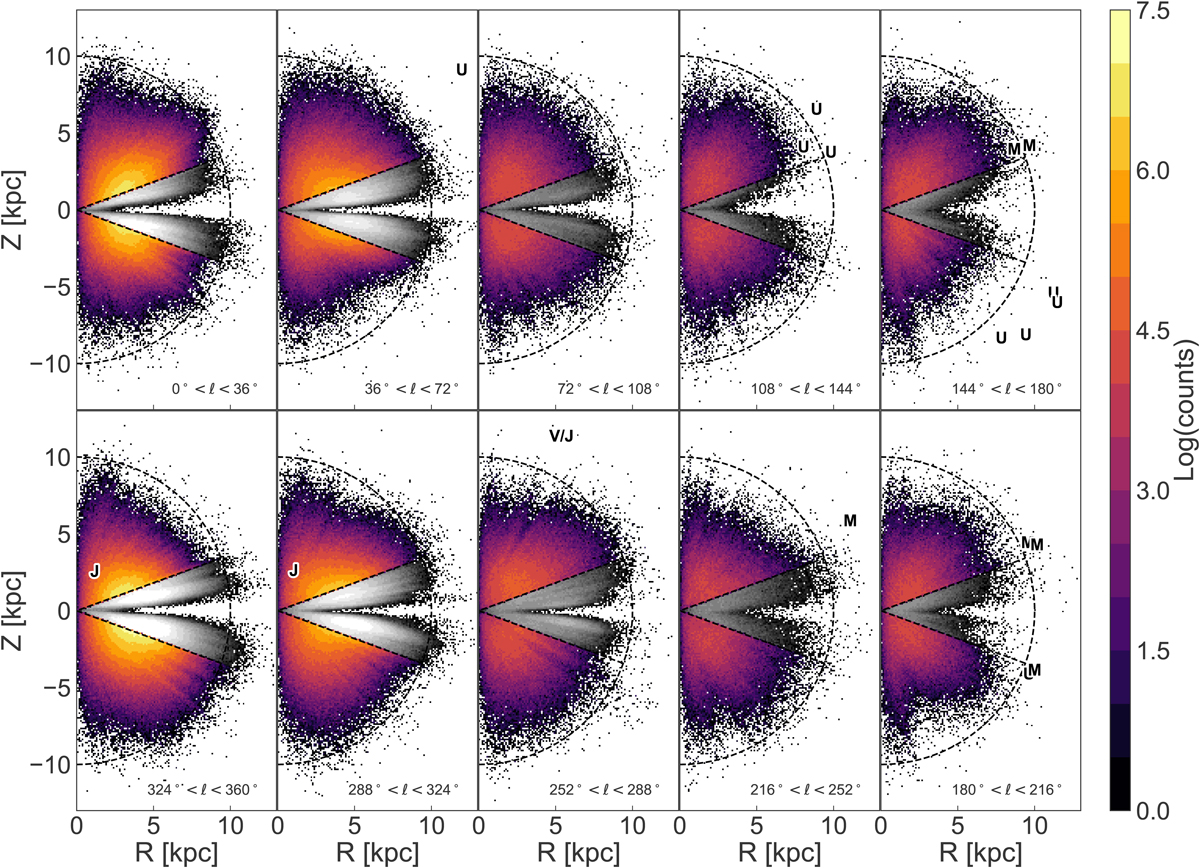
Spatial distribution in wedges of Δℓ=36°, projected in cylindrical heliocentric (R, Z) coordinates. Low latitude (|b|< 20°) areas are desaturated because these are likely contaminated by thick disc stars. The labels correspond to the overdensities found by De Jong et al. (2010, i.e., their Table 4): Virgo (V), Monoceros (M), (6.5, 1.5) (J; detected originally by Juric et al. 2008), and the unlabelled structures (U). These overdensities lie mostly just beyond our sample’s reach, but might become visible with a similar analysis with upcoming Gaia data releases.
Current usage metrics show cumulative count of Article Views (full-text article views including HTML views, PDF and ePub downloads, according to the available data) and Abstracts Views on Vision4Press platform.
Data correspond to usage on the plateform after 2015. The current usage metrics is available 48-96 hours after online publication and is updated daily on week days.
Initial download of the metrics may take a while.