Fig. 8.
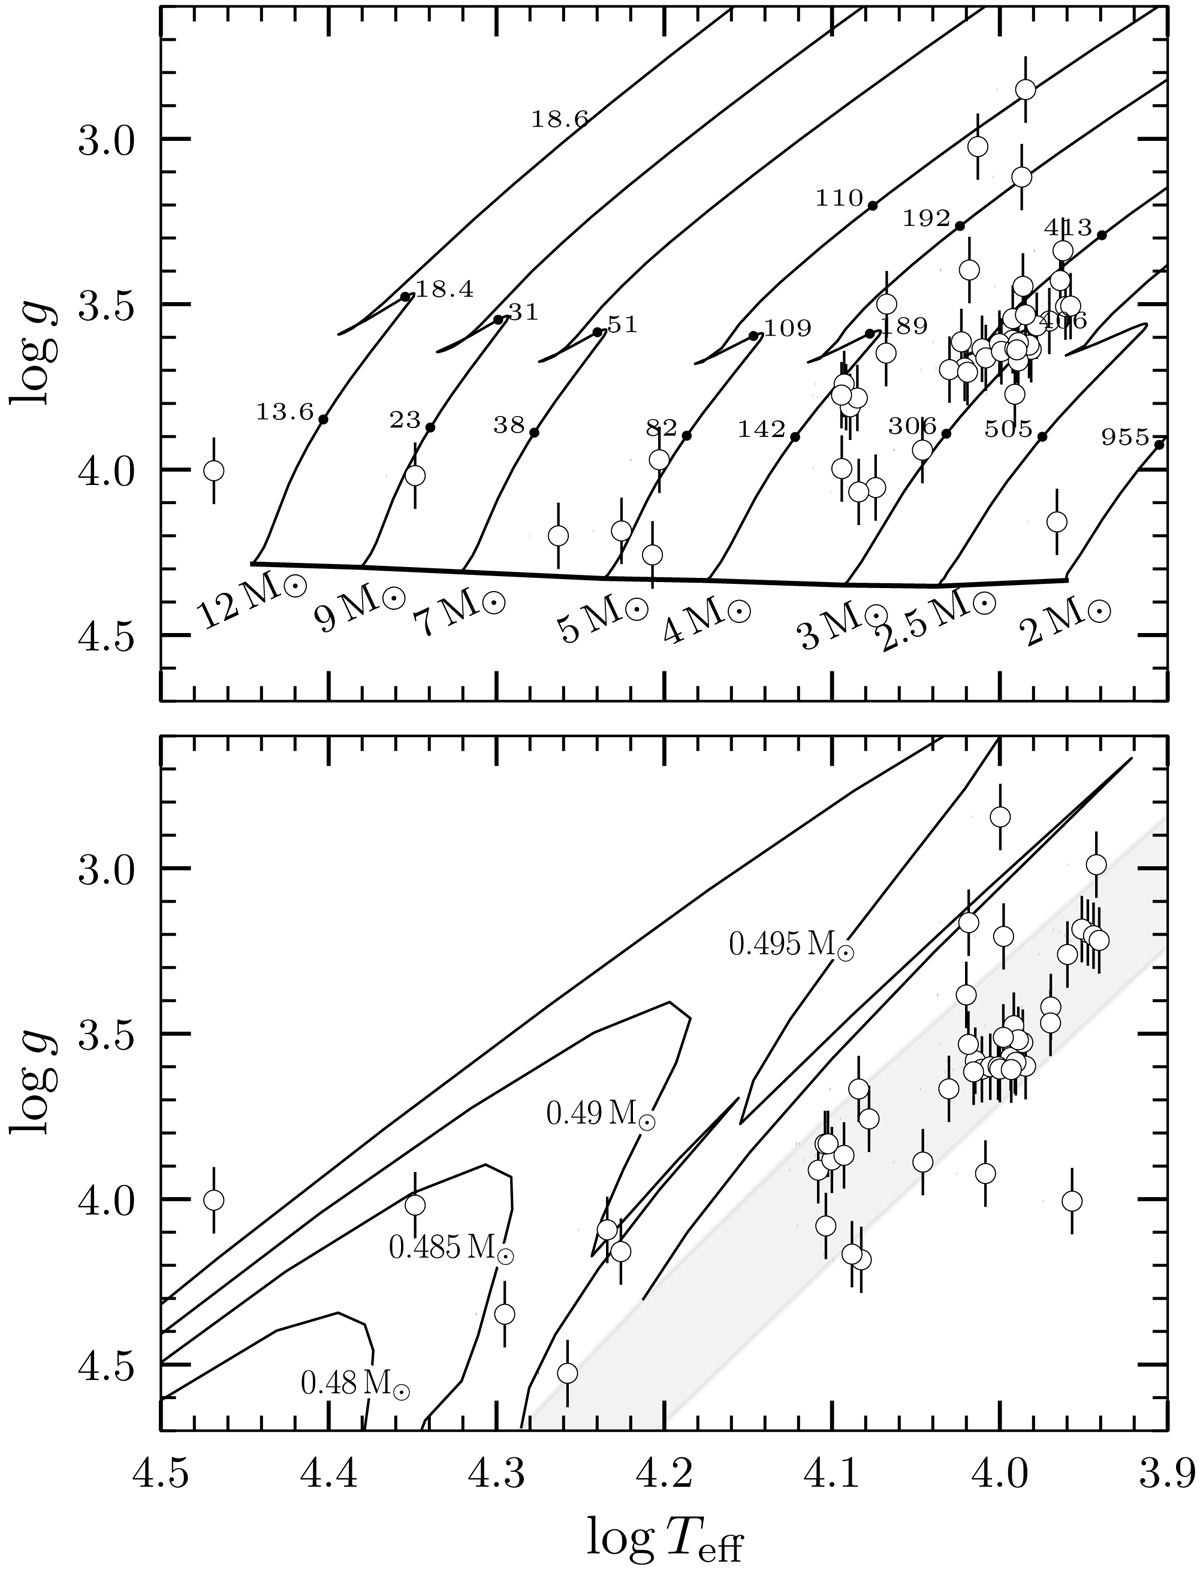
Kiel diagrams showing the atmospheric parameters of the observed stars as determined via the spectroscopic best-fit with model spectra representing MS and BHB stars (top and bottom panels, respectively). Top panel: evolutionary tracks for rotating MS stars are plotted in black (Ekström et al. 2012). The initial masses of each model are noted below the zero-age MS (thick solid curve), while the stellar ages for selected evolutionary points along the tracks are given in mega years. Bottom panel: the horizontal branch is represented by the gray-shaded area, and the evolutionary tracks for post-horizontal branch stars of different masses are drawn as solid curves (Dorman 1992).
Current usage metrics show cumulative count of Article Views (full-text article views including HTML views, PDF and ePub downloads, according to the available data) and Abstracts Views on Vision4Press platform.
Data correspond to usage on the plateform after 2015. The current usage metrics is available 48-96 hours after online publication and is updated daily on week days.
Initial download of the metrics may take a while.