Fig. 5.
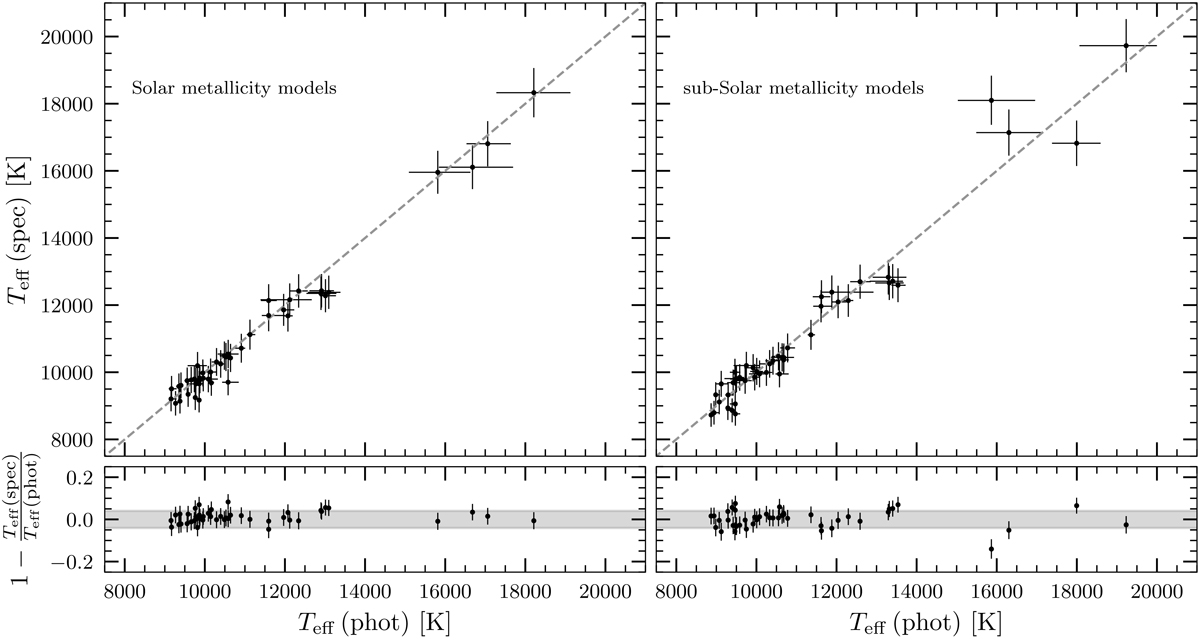
Comparisons between photometric Teff, measured via SED fitting, and spectroscopic Teff. The result for MS (top left panel) and BHB models (top right panel) are shown. The dashed lines represent the equality curves. The residuals are displayed as a function of photometric Teff in the lower panels. The gray-shaded area represents the 4% systematic uncertainty assumed for the spectroscopic results.
Current usage metrics show cumulative count of Article Views (full-text article views including HTML views, PDF and ePub downloads, according to the available data) and Abstracts Views on Vision4Press platform.
Data correspond to usage on the plateform after 2015. The current usage metrics is available 48-96 hours after online publication and is updated daily on week days.
Initial download of the metrics may take a while.