Fig. 13.
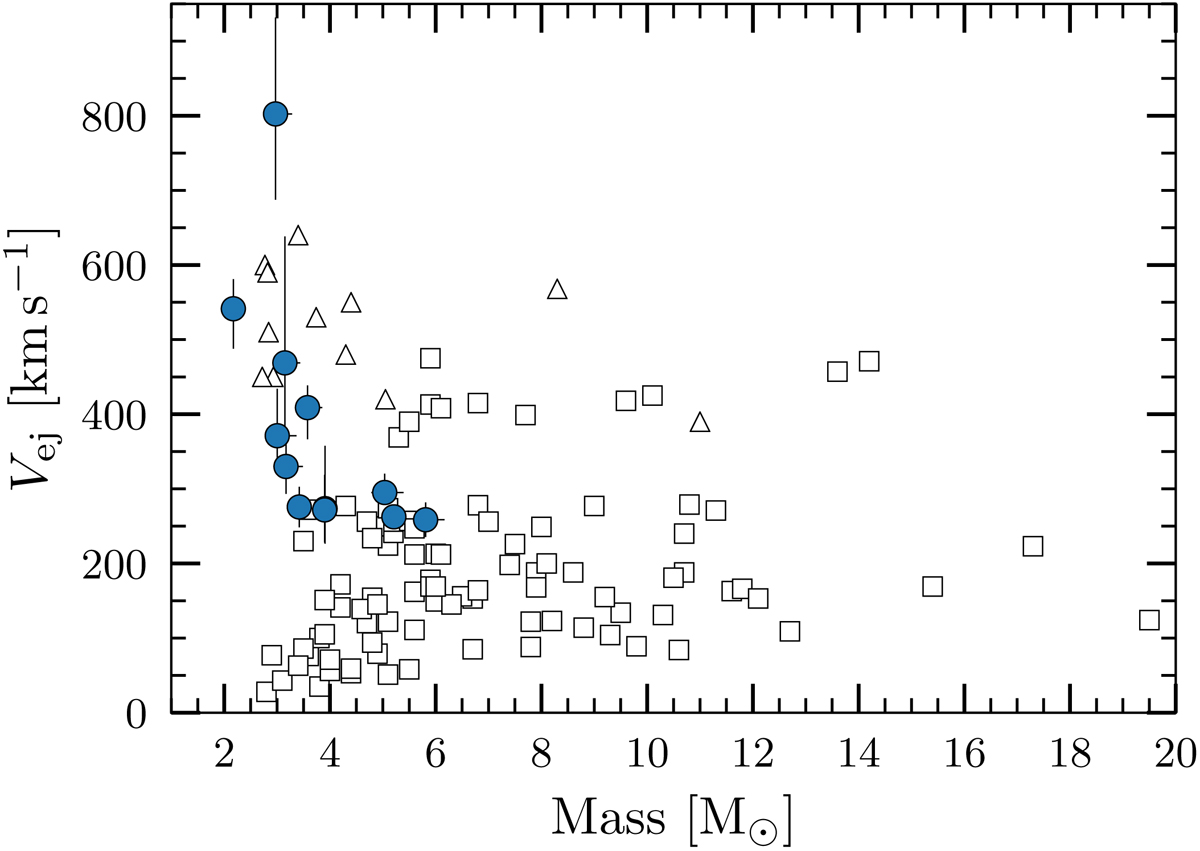
Ejection velocities of runaway stars are plotted against their masses. Our 12 MS runaway candidates are represented by blue circles with error bars; it is important to note that two stars have very similar masses and, thus, overlapping symbols. The runaway stars studied by Silva & Napiwotzki (2011) are plotted as squares. More recently discovered high-velocity runaway stars as listed by Irrgang et al. (2019) are plotted as triangles, with masses updated from Kreuzer et al. (2020) when available.
Current usage metrics show cumulative count of Article Views (full-text article views including HTML views, PDF and ePub downloads, according to the available data) and Abstracts Views on Vision4Press platform.
Data correspond to usage on the plateform after 2015. The current usage metrics is available 48-96 hours after online publication and is updated daily on week days.
Initial download of the metrics may take a while.