Fig. 1.
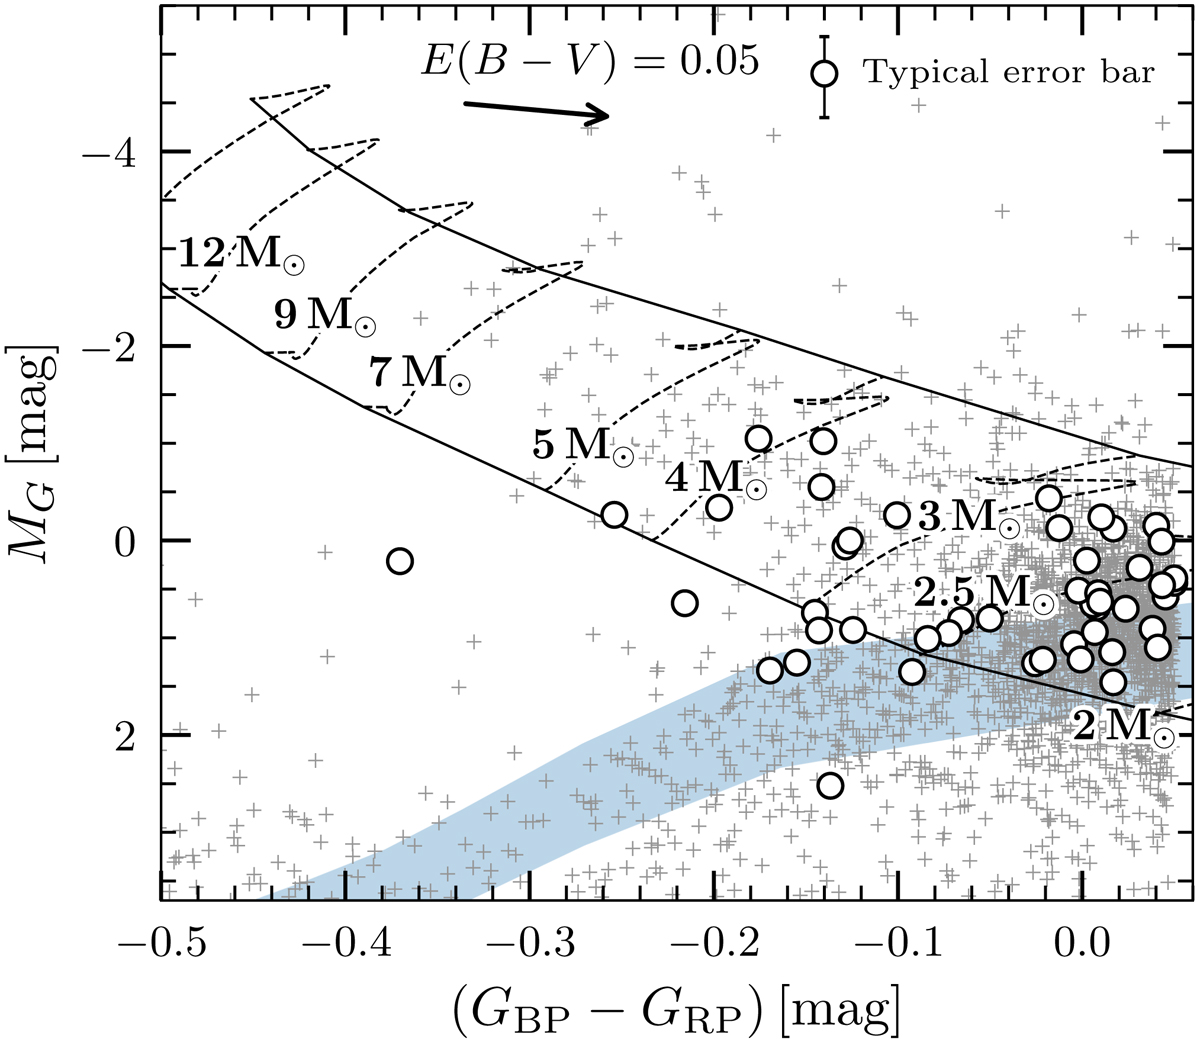
Gaia Hertzsprung-Russell diagram of candidate blue stars at high Galactic latitudes (gray cross symbols). The observed targets are shown as large circles. Solid curves represent the zero-age and terminal-age MS, while the evolutionary tracks for representative initial masses are plotted as dashed curves (Choi et al. 2016). The light-blue strip represents the horizontal branch (Dorman 1992). The reddening vector and typical error bars of the observed targets are displayed at the top edge of the figure.
Current usage metrics show cumulative count of Article Views (full-text article views including HTML views, PDF and ePub downloads, according to the available data) and Abstracts Views on Vision4Press platform.
Data correspond to usage on the plateform after 2015. The current usage metrics is available 48-96 hours after online publication and is updated daily on week days.
Initial download of the metrics may take a while.