Fig. 8
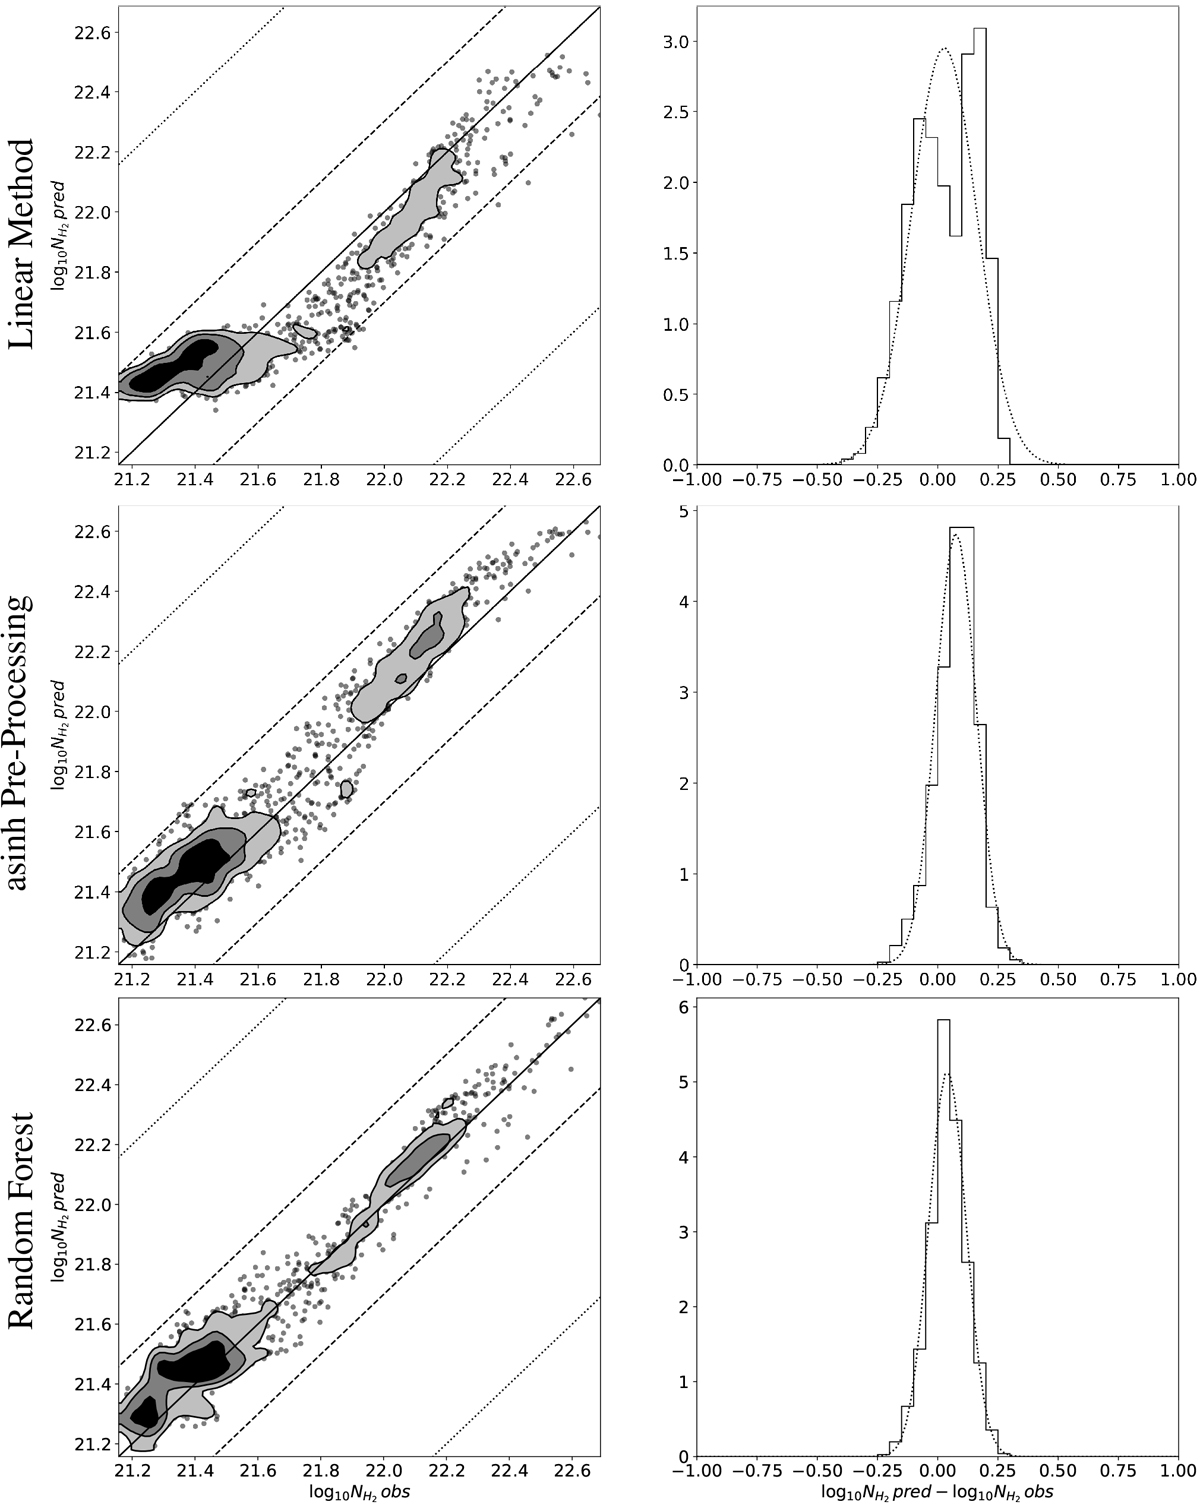
Comparison of the generalization performances of three predictors. Top row: linear method. Middle row: linear method with a non-linear pre-processing. Bottom row: random forest. All results are computed on the Horsehead pillar, i.e., the test set. Left column: joint Probability Distribution Function (PDF) of the predicted column density and of the observed one. The contours are the PDF isocontours enclosing 25, 50, and 75% of the datapoints. Points whose density falls below these values are shown as black dots. The oblique lines have a slope of 1. They indicates ratio values of 1.0 (plain), 0.5 and 2.0 (dashed), 0.1 and 10.0 (dotted). Right column: histogram of the ratio of the predicted column density over the observed one on a logarithmic scale. The dotted lines show the Gaussian of same mean and width.
Current usage metrics show cumulative count of Article Views (full-text article views including HTML views, PDF and ePub downloads, according to the available data) and Abstracts Views on Vision4Press platform.
Data correspond to usage on the plateform after 2015. The current usage metrics is available 48-96 hours after online publication and is updated daily on week days.
Initial download of the metrics may take a while.