Fig. 7
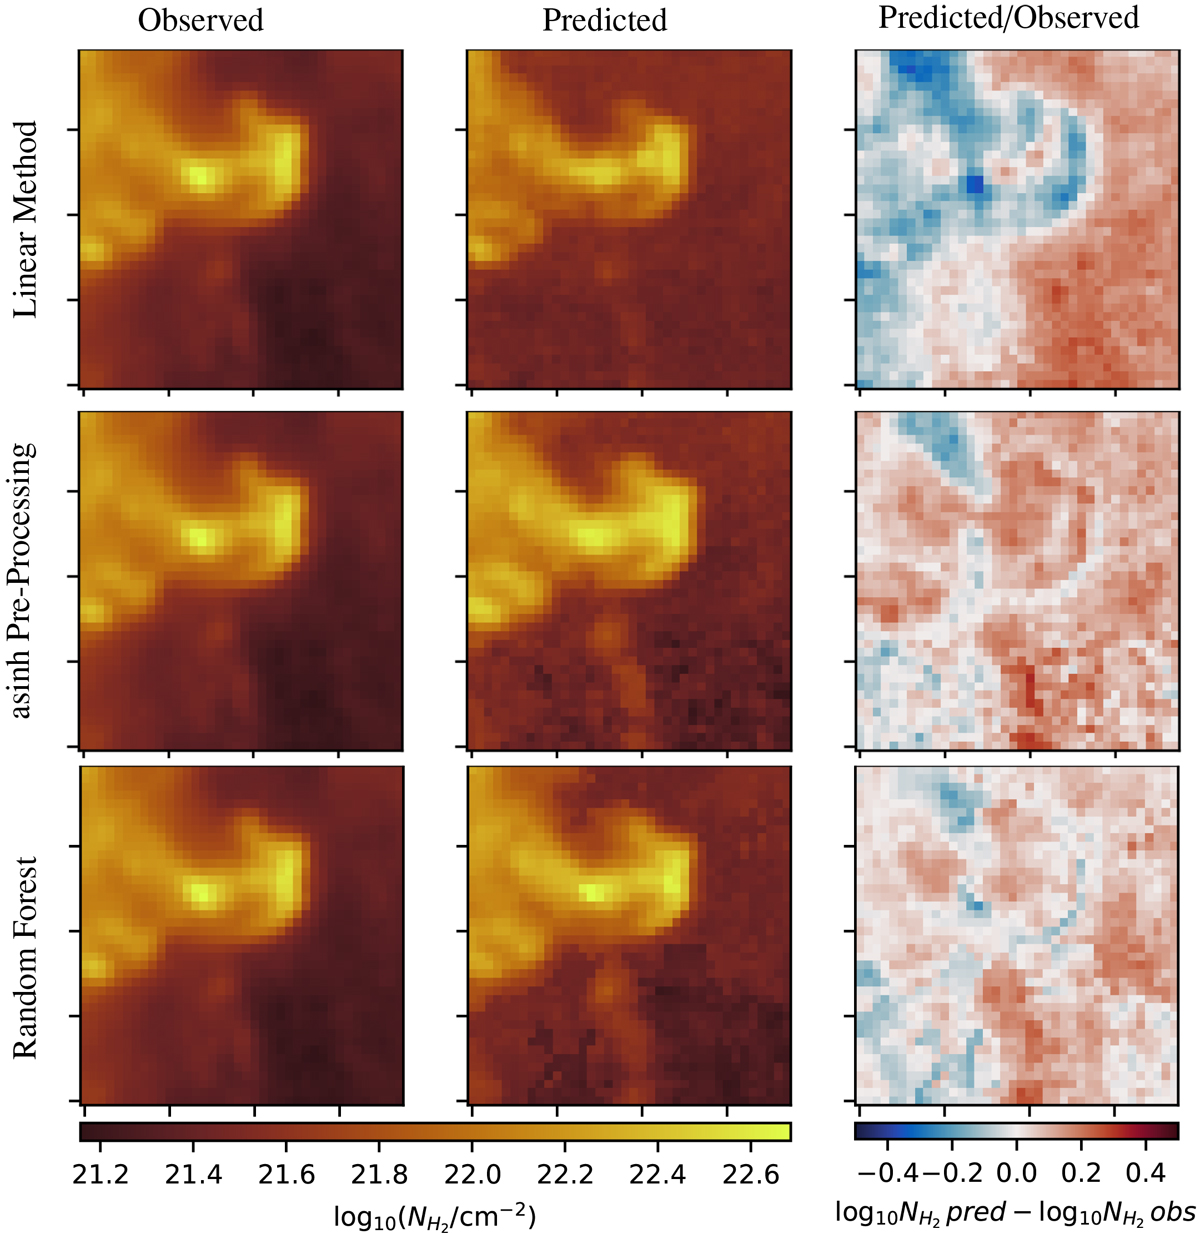
Comparison of the generalization performances of three predictors. Top row: linear method. Middle row: linear method with a non-linear pre-processing. Bottom row: random forest. All results are computed on the Horsehead pillar, i.e., the test set. Left and middle columns: spatial distribution of the observed and predicted column density. Both images share the same color scale. Right column: ratio of the predicted column density over the observed one. The limits of the color scale correspond to a ratio interval from 1∕3 to 3.
Current usage metrics show cumulative count of Article Views (full-text article views including HTML views, PDF and ePub downloads, according to the available data) and Abstracts Views on Vision4Press platform.
Data correspond to usage on the plateform after 2015. The current usage metrics is available 48-96 hours after online publication and is updated daily on week days.
Initial download of the metrics may take a while.