Fig. 6
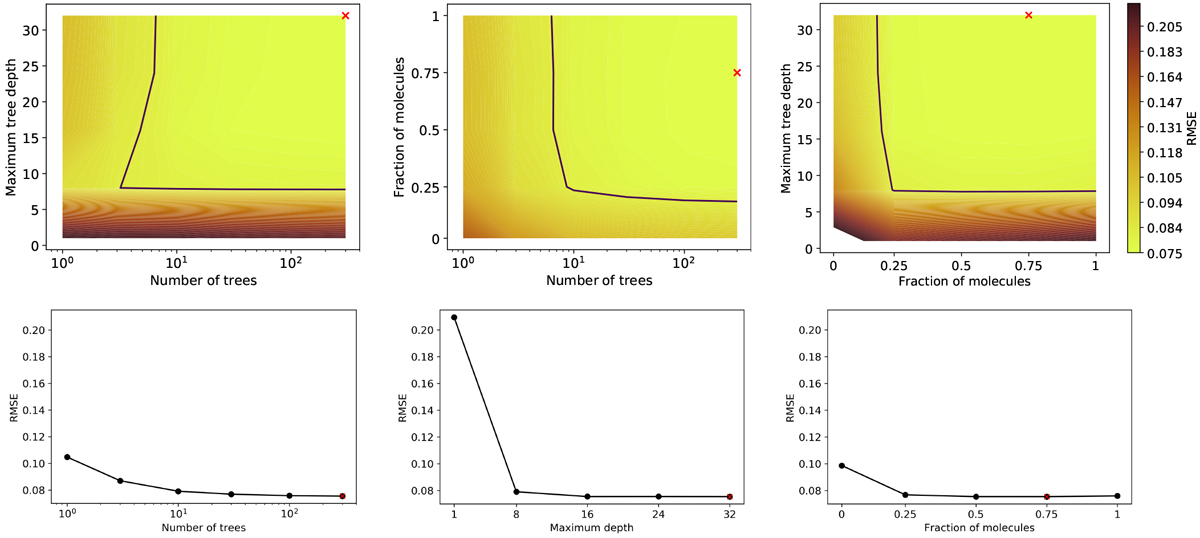
Variations of the root mean square error (RMSE) between the predicted and the observed ![]() computed on the validation set when optimizing the random forest hyper-parameters: (1) the number of trees in the forest, (2) the maximum depth of one tree, and (3) the number of features (line peak temperatures and integrated intensities) randomly chosen to train each individual regression tree of the forest. Bi-dimensional (top) and mono-dimensional (bottom) cuts going through the minimum RMSE over the full cube. The space of acceptable parameters is shown inside the black contours (minimum plus 10%). The minimum values are shown as the red crosses in all cases.
computed on the validation set when optimizing the random forest hyper-parameters: (1) the number of trees in the forest, (2) the maximum depth of one tree, and (3) the number of features (line peak temperatures and integrated intensities) randomly chosen to train each individual regression tree of the forest. Bi-dimensional (top) and mono-dimensional (bottom) cuts going through the minimum RMSE over the full cube. The space of acceptable parameters is shown inside the black contours (minimum plus 10%). The minimum values are shown as the red crosses in all cases.
Current usage metrics show cumulative count of Article Views (full-text article views including HTML views, PDF and ePub downloads, according to the available data) and Abstracts Views on Vision4Press platform.
Data correspond to usage on the plateform after 2015. The current usage metrics is available 48-96 hours after online publication and is updated daily on week days.
Initial download of the metrics may take a while.